


Industrial properties in Europe
Companyspace.com today:
New today 2,965
Updated 24h 2,971
Notifications about new companyspaces2,189
Copenhagen +6
Stockholm +10
Amsterdam +3
Berlin +3
Vienna +6
Paris +5
Madrid +4
Dublin (county) +23
Warsaw +19
Greater London +14
Latest update 3 h ago
Active ads 369,199
19,091 industrial properties found
Industrial property in Södertälje, Stockholm County
 More info
Industrial property in Södertälje, Stockholm County
Industrial property for rent in Södertälje, Stockholm County
Areal
Ca. 405 m2
Pris pr. md.
Ca. 42,200 SEK pr md
Område
Södertälje, Stockholm County
Type
Industrial property
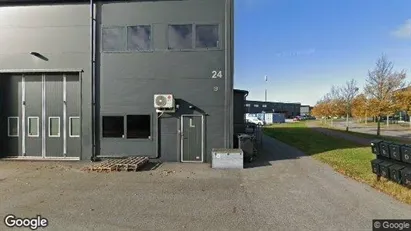
Warehouse in Nørresundby, North Jutland Region
 More info
Warehouse in Nørresundby, North Jutland Region
Warehouse for rent in Nørresundby, North Jutland Region
Areal
Ca. 100 m2
Pris pr. md.
Ca. 3,800 DKK pr md
Område
Nørresundby, North Jutland Region
Type
Warehouse
Industrial property in Lynge, North Zealand
 More info
Industrial property in Lynge, North Zealand
Industrial property for rent in Lynge, North Zealand
Areal
Ca. 500 m2
Pris pr. md.
Ca. 25,000 DKK pr md
Område
Lynge, North Zealand
Type
Industrial property
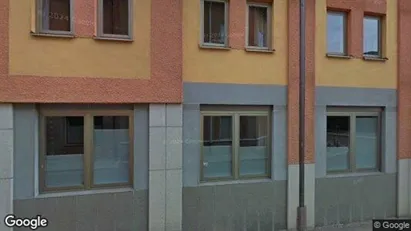
Industrial property in Copenhagen K, Copenhagen
 More info
Industrial property in Copenhagen K, Copenhagen
Industrial property for rent in Copenhagen K, Copenhagen
Areal
Ca. 45 m2
Pris pr. md.
Ca. 7,350 DKK pr md
Område
Copenhagen K, Copenhagen
Type
Industrial property
Industrial property in Sakskøbing, Region Zealand
 More info
Industrial property in Sakskøbing, Region Zealand
Industrial property for rent in Sakskøbing, Region Zealand
Areal
Ca. 500 m2
Pris pr. md.
Ca. 12,500 DKK pr md
Område
Sakskøbing, Region Zealand
Type
Industrial property
Industrial property in Snertinge, Region Zealand
 More info
Industrial property in Snertinge, Region Zealand
Industrial property for rent in Snertinge, Region Zealand
Areal
Ca. 300 m2
Pris pr. md.
Ca. 7,000 DKK pr md
Område
Snertinge, Region Zealand
Type
Industrial property
Industrial property in Odense SØ, Odense
 More info
Industrial property in Odense SØ, Odense
Industrial property for rent in Odense SØ, Odense
Areal
Ca. 275 m2
Pris pr. md.
Ca. 17,500 DKK pr md
Område
Odense SØ, Odense
Type
Industrial property
Industrial property in Vallentuna, Stockholm County
 More info
Industrial property in Vallentuna, Stockholm County
Industrial property for rent in Vallentuna, Stockholm County
Areal
Ca. 150 m2
Pris pr. md.
Ca. 27,000 SEK pr md
Område
Vallentuna, Stockholm County
Type
Industrial property
Warehouse in Nørresundby, North Jutland Region
 More info
Warehouse in Nørresundby, North Jutland Region
Warehouse for rent in Nørresundby, North Jutland Region
Areal
Ca. 100 m2
Pris pr. md.
Ca. 3,800 DKK pr md
Område
Nørresundby, North Jutland Region
Type
Warehouse
Warehouse in Fjerritslev, North Jutland Region
 More info
Warehouse in Fjerritslev, North Jutland Region
Warehouse for rent in Fjerritslev, North Jutland Region
Areal
Ca. 425 m2
Pris pr. md.
Ca. 6,650 DKK pr md
Område
Fjerritslev, North Jutland Region
Type
Warehouse
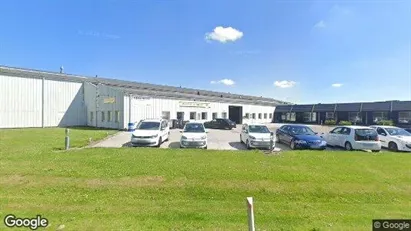
Industrial property in Hedensted, Central Jutland Region
 More info
Industrial property in Hedensted, Central Jutland Region
Industrial property for rent in Hedensted, Central Jutland Region
Areal
Ca. 590 m2
Pris pr. md.
Ca. 22,000 DKK pr md
Område
Hedensted, Central Jutland Region
Type
Industrial property
Industrial property in Stoholm Jyll, Central Jutland Region
 More info
Industrial property in Stoholm Jyll, Central Jutland Region
Industrial property for rent in Stoholm Jyll, Central Jutland Region
Areal
Ca. 400 m2
Pris pr. md.
Ca. 7,000 DKK pr md
Område
Stoholm Jyll, Central Jutland Region
Type
Industrial property
Industrial property in Randers SV, Central Jutland Region
 More info
Industrial property in Randers SV, Central Jutland Region
Industrial property for rent in Randers SV, Central Jutland Region
Areal
Ca. 310 m2
Pris pr. md.
Ca. 11,600 DKK pr md
Område
Randers SV, Central Jutland Region
Type
Industrial property
Industrial property in Randers NV, Randers
 More info
Industrial property in Randers NV, Randers
Industrial property for rent in Randers NV, Randers
Areal
20 - 7,000 m2
Pris pr. md.
Ca. 204,150 DKK pr md
Område
Randers NV, Randers
Type
Industrial property
Industrial property in Agerbæk, Region of Southern Denmark
 More info
Industrial property in Agerbæk, Region of Southern Denmark
Industrial property for rent in Agerbæk, Region of Southern Denmark
Areal
500 - 10,300 m2
Pris pr. md.
Ca. 150,200 DKK pr md
Område
Agerbæk, Region of Southern Denmark
Type
Industrial property
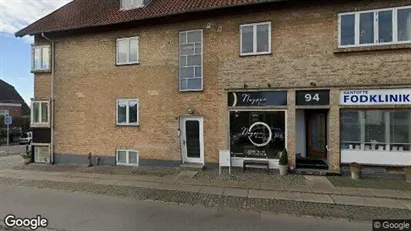
Warehouse in Gentofte, Greater Copenhagen
 More info
Warehouse in Gentofte, Greater Copenhagen
Warehouse for rent in Gentofte, Greater Copenhagen
Areal
Ca. 60 m2
Pris pr. md.
Not stated
Område
Gentofte, Greater Copenhagen
Type
Warehouse
Industrial property in Borlänge, Dalarna
 More info
Industrial property in Borlänge, Dalarna
Industrial property for rent in Borlänge, Dalarna
Areal
120 - 900 m2
Pris pr. md.
Ca. 96,750 SEK pr md
Område
Borlänge, Dalarna
Type
Industrial property
Industrial property in Vellinge, Skåne County
 More info
Industrial property in Vellinge, Skåne County
Industrial property for rent in Vellinge, Skåne County
Areal
Ca. 170 m2
Pris pr. md.
Ca. 14,000 SEK pr md
Område
Vellinge, Skåne County
Type
Industrial property
Selected customers
30,000 customers use Companyspace.com
30,000 customers
285,000 companies in our database
2,400 rentals annually
Companyspace.com is used by thousands of landlords, property companies, commercial real estate agents, investors and business centres seeking greater visibility, more enquiries and lower vacancy rates.


