


Industrial properties in Europe
Companyspace.com today:
New today 2,965
Updated 24h 2,974
Notifications about new companyspaces2,189
Copenhagen +6
Stockholm +10
Amsterdam +3
Berlin +3
Vienna +6
Paris +5
Madrid +4
Dublin (county) +23
Warsaw +19
Greater London +14
Latest update 3 h ago
Active ads 369,199
19,091 industrial properties found
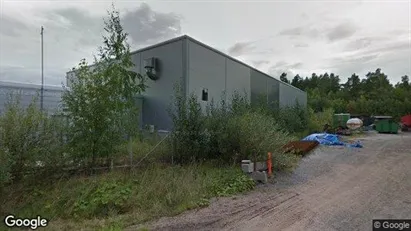
Industrial property in Riihimäki, Kanta-Häme
 More info
Industrial property in Riihimäki, Kanta-Häme
Industrial property for rent in Riihimäki, Kanta-Häme
Areal
Ca. 385 m2
Pris pr. md.
Ca. 1,900 EUR pr md
Område
Riihimäki, Kanta-Häme
Type
Industrial property
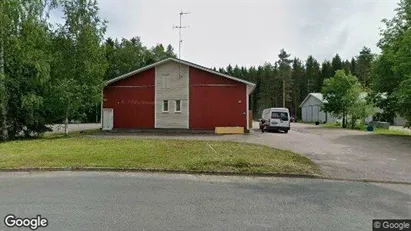
Industrial property in Raisio, Varsinais-Suomi
 More info
Industrial property in Raisio, Varsinais-Suomi
Industrial property for rent in Raisio, Varsinais-Suomi
Areal
Ca. 1,250 m2
Pris pr. md.
Ca. 10,000 EUR pr md
Område
Raisio, Varsinais-Suomi
Type
Industrial property
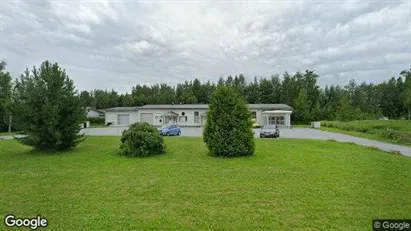
Industrial property in Loppi, Kanta-Häme
 More info
Industrial property in Loppi, Kanta-Häme
Industrial property for rent in Loppi, Kanta-Häme
Areal
Ca. 10 m2
Pris pr. md.
Ca. 3,000 EUR pr md
Område
Loppi, Kanta-Häme
Type
Industrial property
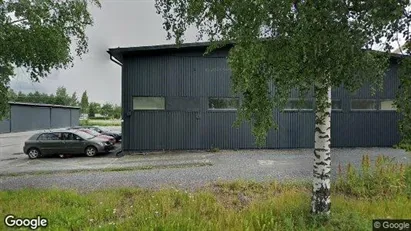
Industrial property in Joensuu, Pohjois-Karjala
 More info
Industrial property in Joensuu, Pohjois-Karjala
Industrial property for rent in Joensuu, Pohjois-Karjala
Areal
Ca. 175 m2
Pris pr. md.
Ca. 1,600 EUR pr md
Område
Joensuu, Pohjois-Karjala
Type
Industrial property
Industrial property in Hyvinkää, Uusimaa
 More info
Industrial property in Hyvinkää, Uusimaa
Industrial property for rent in Hyvinkää, Uusimaa
Areal
Ca. 105 m2
Pris pr. md.
Ca. 850 EUR pr md
Område
Hyvinkää, Uusimaa
Type
Industrial property
Industrial property in Pori, Satakunta
 More info
Industrial property in Pori, Satakunta
Industrial property for rent in Pori, Satakunta
Areal
Ca. 95 m2
Pris pr. md.
Ca. 550 EUR pr md
Område
Pori, Satakunta
Type
Industrial property
Industrial property in Riihimäki, Kanta-Häme
 More info
Industrial property in Riihimäki, Kanta-Häme
Industrial property for rent in Riihimäki, Kanta-Häme
Areal
Ca. 680 m2
Pris pr. md.
Ca. 3,400 EUR pr md
Område
Riihimäki, Kanta-Häme
Type
Industrial property
Industrial property in Pori, Satakunta
 More info
Industrial property in Pori, Satakunta
Industrial property for rent in Pori, Satakunta
Areal
Ca. 120 m2
Pris pr. md.
Ca. 650 EUR pr md
Område
Pori, Satakunta
Type
Industrial property
Industrial property in Hyvinkää, Uusimaa
 More info
Industrial property in Hyvinkää, Uusimaa
Industrial property for rent in Hyvinkää, Uusimaa
Areal
Ca. 195 m2
Pris pr. md.
Ca. 1,450 EUR pr md
Område
Hyvinkää, Uusimaa
Type
Industrial property
Industrial property in Järvenpää, Uusimaa
 More info
Industrial property in Järvenpää, Uusimaa
Industrial property for rent in Järvenpää, Uusimaa
Areal
Ca. 150 m2
Pris pr. md.
Ca. 1,300 EUR pr md
Område
Järvenpää, Uusimaa
Type
Industrial property
Industrial property in Kouvola, Kymenlaakso
 More info
Industrial property in Kouvola, Kymenlaakso
Industrial property for rent in Kouvola, Kymenlaakso
Areal
Ca. 570 m2
Pris pr. md.
Ca. 3,200 EUR pr md
Område
Kouvola, Kymenlaakso
Type
Industrial property
Industrial property in Keminmaa, Lappi
 More info
Industrial property in Keminmaa, Lappi
Industrial property for rent in Keminmaa, Lappi
Areal
Ca. 215 m2
Pris pr. md.
Ca. 1,750 EUR pr md
Område
Keminmaa, Lappi
Type
Industrial property
Industrial property in Helsinki Pohjoinen, Helsinki
 More info
Industrial property in Helsinki Pohjoinen, Helsinki
Industrial property for rent in Helsinki Pohjoinen, Helsinki
Areal
Ca. 775 m2
Pris pr. md.
Ca. 10,000 EUR pr md
Område
Helsinki Pohjoinen, Helsinki
Type
Industrial property
Industrial property in Riihimäki, Kanta-Häme
 More info
Industrial property in Riihimäki, Kanta-Häme
Industrial property for rent in Riihimäki, Kanta-Häme
Areal
Ca. 1,000 m2
Pris pr. md.
Ca. 6,500 EUR pr md
Område
Riihimäki, Kanta-Häme
Type
Industrial property
Industrial property in Eurajoki, Satakunta
 More info
Industrial property in Eurajoki, Satakunta
Industrial property for rent in Eurajoki, Satakunta
Areal
Ca. 400 m2
Pris pr. md.
Ca. 2,000 EUR pr md
Område
Eurajoki, Satakunta
Type
Industrial property
Industrial property in Askola, Uusimaa
 More info
Industrial property in Askola, Uusimaa
Industrial property for rent in Askola, Uusimaa
Areal
Ca. 500 m2
Pris pr. md.
Ca. 3,000 EUR pr md
Område
Askola, Uusimaa
Type
Industrial property
Industrial property in Helsinki Itäinen, Helsinki
 More info
Industrial property in Helsinki Itäinen, Helsinki
Industrial property for rent in Helsinki Itäinen, Helsinki
Areal
Ca. 145 m2
Pris pr. md.
Ca. 1,500 EUR pr md
Område
Helsinki Itäinen, Helsinki
Type
Industrial property
Industrial property in Salo, Varsinais-Suomi
 More info
Industrial property in Salo, Varsinais-Suomi
Industrial property for rent in Salo, Varsinais-Suomi
Areal
Ca. 765 m2
Pris pr. md.
Ca. 4,900 EUR pr md
Område
Salo, Varsinais-Suomi
Type
Industrial property
Selected customers
30,000 customers use Companyspace.com
30,000 customers
285,000 companies in our database
2,400 rentals annually
Companyspace.com is used by thousands of landlords, property companies, commercial real estate agents, investors and business centres seeking greater visibility, more enquiries and lower vacancy rates.


