


Industrial properties in Europe
Companyspace.com today:
New today 889
Updated 24h 1,225
Notifications about new companyspaces27
Copenhagen +133
Stockholm +1
Vienna +3
Latest update 3 min ago
Active ads 369,271
19,034 industrial properties found
Warehouse in Glamsbjerg, Funen
 More info
Warehouse in Glamsbjerg, Funen
Warehouse for rent in Glamsbjerg, Funen
Areal
Ca. 165 m2
Pris pr. md.
Ca. 6,500 DKK pr md
Område
Glamsbjerg, Funen
Type
Warehouse
Warehouse in Brabrand, Aarhus
 More info
Warehouse in Brabrand, Aarhus
Warehouse for rent in Brabrand, Aarhus
Areal
Ca. 145 m2
Pris pr. md.
Ca. 9,900 DKK pr md
Område
Brabrand, Aarhus
Type
Warehouse
Warehouse in Copenhagen S, Copenhagen
 More info
Warehouse in Copenhagen S, Copenhagen
Warehouse for rent in Copenhagen S, Copenhagen
Areal
Ca. 195 m2
Pris pr. md.
Ca. 8,200 DKK pr md
Område
Copenhagen S, Copenhagen
Type
Warehouse
Office space in Oulu, Pohjois-Pohjanmaa
 More info
Office space in Oulu, Pohjois-Pohjanmaa
Office space for rent in Oulu, Pohjois-Pohjanmaa
Areal
Ca. 480 m2
Pris pr. md.
Ca. 5,700 EUR pr md
Område
Oulu, Pohjois-Pohjanmaa
Type
Office space
Industrial property in Almelo, Overijssel
 More info
Industrial property in Almelo, Overijssel
Productie te koop in Almelo, Overijssel
Areal
Ca. 800 m2
Pris
Ca. 735,000EUR
Område
Almelo, Overijssel
Type
Industrial property
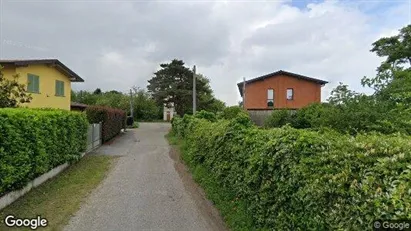
Warehouse in Vigevano, Lombardia
 More info
Warehouse in Vigevano, Lombardia
Warehouse for rent in Vigevano, Lombardia
Areal
Ca. 860 m2
Pris pr. md.
Ca. 425,000 EUR pr md
Område
Vigevano, Lombardia
Type
Warehouse
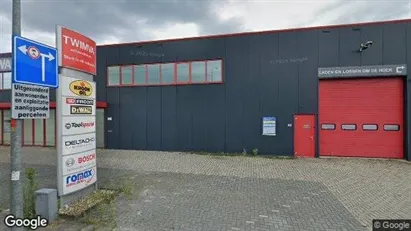
Industrial property in Enschede, Overijssel
 More info
Industrial property in Enschede, Overijssel
Productie te koop in Enschede, Overijssel
Areal
Ca. 125 m2
Pris
Ca. 198,000EUR
Område
Enschede, Overijssel
Type
Industrial property
Industrial property in Enschede, Overijssel
 More info
Industrial property in Enschede, Overijssel
Productie te koop in Enschede, Overijssel
Areal
Ca. 120 m2
Pris
Ca. 173,000EUR
Område
Enschede, Overijssel
Type
Industrial property
Industrial property in Enschede, Overijssel
 More info
Industrial property in Enschede, Overijssel
Productie te koop in Enschede, Overijssel
Areal
Ca. 165 m2
Pris
Ca. 258,000EUR
Område
Enschede, Overijssel
Type
Industrial property
Industrial property in Enschede, Overijssel
 More info
Industrial property in Enschede, Overijssel
Productie te koop in Enschede, Overijssel
Areal
Ca. 120 m2
Pris
Ca. 173,000EUR
Område
Enschede, Overijssel
Type
Industrial property
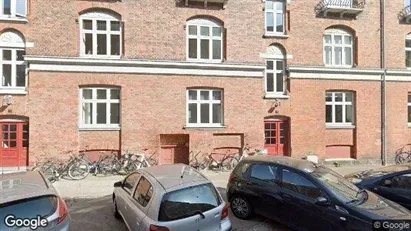
Office space in Nørrebro, Copenhagen
 More info
Office space in Nørrebro, Copenhagen
Office space for rent in Nørrebro, Copenhagen
Areal
Ca. 40 m2
Pris pr. md.
Ca. 7,000 DKK pr md
Område
Nørrebro, Copenhagen
Type
Office space
Industrial property in Enschede, Overijssel
 More info
Industrial property in Enschede, Overijssel
Productie te koop in Enschede, Overijssel
Areal
Ca. 160 m2
Pris
Ca. 275,000EUR
Område
Enschede, Overijssel
Type
Industrial property
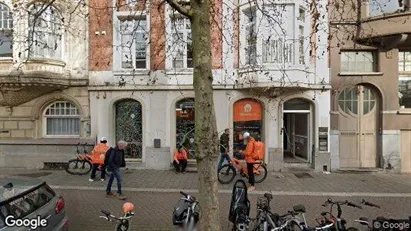
Office space in Stad Gent, Gent
 More info
Office space in Stad Gent, Gent
Office space for rent in Stad Gent, Gent
Areal
Ca. 440 m2
Pris pr. md.
Ca. 4,800 EUR pr md
Område
Stad Gent, Gent
Type
Office space
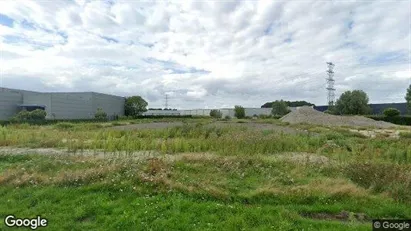
Industrial property in Næstved, Region Zealand
 More info
Industrial property in Næstved, Region Zealand
Industrial property for rent in Næstved, Region Zealand
Areal
100 - 2,000 m2
Pris pr. md.
Ca. 58,350 DKK pr md
Område
Næstved, Region Zealand
Type
Industrial property
Industrial property in Södertälje, Stockholm County
 More info
Industrial property in Södertälje, Stockholm County
Industrial property for rent in Södertälje, Stockholm County
Areal
Ca. 405 m2
Pris pr. md.
Ca. 42,200 SEK pr md
Område
Södertälje, Stockholm County
Type
Industrial property
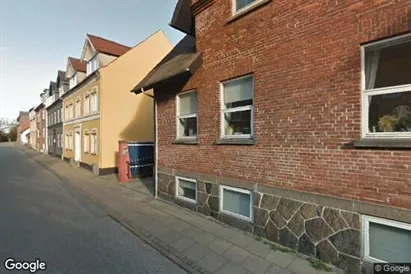
Warehouse in Nørresundby, North Jutland Region
 More info
Warehouse in Nørresundby, North Jutland Region
Warehouse for rent in Nørresundby, North Jutland Region
Areal
Ca. 100 m2
Pris pr. md.
Ca. 3,800 DKK pr md
Område
Nørresundby, North Jutland Region
Type
Warehouse
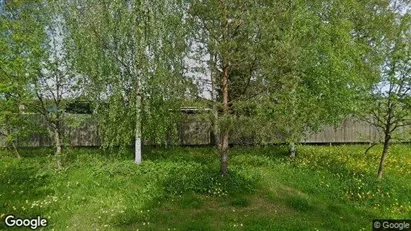
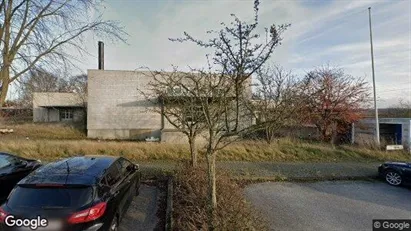
Industrial property in Lynge, North Zealand
 More info
Industrial property in Lynge, North Zealand
Industrial property for rent in Lynge, North Zealand
Areal
Ca. 500 m2
Pris pr. md.
Ca. 25,000 DKK pr md
Område
Lynge, North Zealand
Type
Industrial property
Industrial property in Copenhagen K, Copenhagen
 More info
Industrial property in Copenhagen K, Copenhagen
Industrial property for rent in Copenhagen K, Copenhagen
Areal
Ca. 45 m2
Pris pr. md.
Ca. 7,350 DKK pr md
Område
Copenhagen K, Copenhagen
Type
Industrial property
Selected customers
30,000 customers use Companyspace.com
30,000 customers
285,000 companies in our database
2,400 rentals annually
Companyspace.com is used by thousands of landlords, property companies, commercial real estate agents, investors and business centres seeking greater visibility, more enquiries and lower vacancy rates.


