


Industrial properties in Europe
Companyspace.com today:
New today 2,965
Updated 24h 3,123
Notifications about new companyspaces2,183
Copenhagen +6
Stockholm +10
Amsterdam +3
Berlin +3
Vienna +6
Paris +5
Madrid +4
Dublin (county) +23
Warsaw +19
Greater London +14
Latest update 1 h ago
Active ads 369,199
19,091 industrial properties found
Industrial property in Lappeenranta, Etelä-Karjala
 More info
Industrial property in Lappeenranta, Etelä-Karjala
Industrial property for rent in Lappeenranta, Etelä-Karjala
Areal
-
Pris pr. md.
Ca. 1,350 EUR pr md
Område
Lappeenranta, Etelä-Karjala
Type
Industrial property
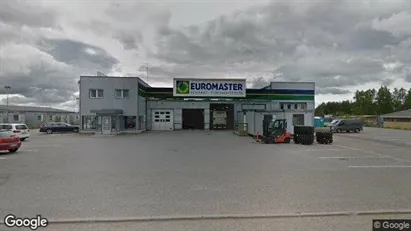
Industrial property in Mustasaari, Pohjanmaa
 More info
Industrial property in Mustasaari, Pohjanmaa
Industrial property for rent in Mustasaari, Pohjanmaa
Areal
Ca. 885 m2
Pris pr. md.
Ca. 5,500 EUR pr md
Område
Mustasaari, Pohjanmaa
Type
Industrial property
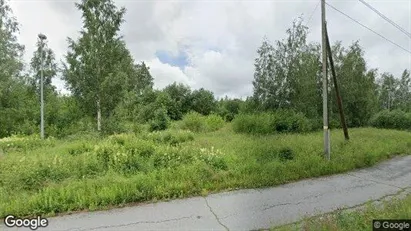
Industrial property in Pori, Satakunta
 More info
Industrial property in Pori, Satakunta
Industrial property for rent in Pori, Satakunta
Areal
Ca. 1,200 m2
Pris pr. md.
Ca. 7,000 EUR pr md
Område
Pori, Satakunta
Type
Industrial property
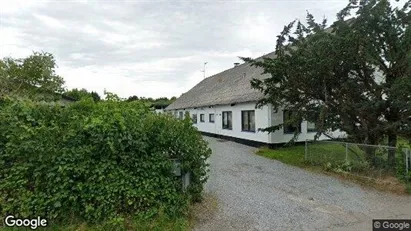
Industrial property in Kvam, Hordaland
 More info
Industrial property in Kvam, Hordaland
Industrial property for sale in Kvam, Hordaland
Areal
Ca. 4,920 m2
Pris
Ca. 5,408,000EUR
Område
Kvam, Hordaland
Type
Industrial property
Industrial property in Almelo, Overijssel
 More info
Industrial property in Almelo, Overijssel
Productie te koop in Almelo, Overijssel
Areal
Ca. 1,000 m2
Pris
Ca. 589,000EUR
Område
Almelo, Overijssel
Type
Industrial property
Warehouse in Hornbæk, North Zealand
 More info
Warehouse in Hornbæk, North Zealand
Warehouse for rent in Hornbæk, North Zealand
Areal
Ca. 430 m2
Pris pr. md.
Ca. 17,900 DKK pr md
Område
Hornbæk, North Zealand
Type
Warehouse
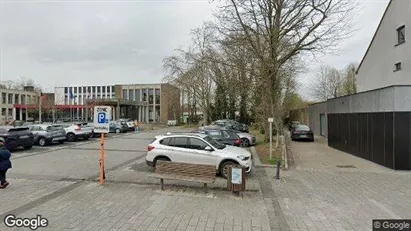
Office space in De Pinte, Oost-Vlaanderen
 More info
Office space in De Pinte, Oost-Vlaanderen
Office space for rent in De Pinte, Oost-Vlaanderen
Areal
Ca. 300 m2
Pris pr. md.
Ca. 1,000 EUR pr md
Område
De Pinte, Oost-Vlaanderen
Type
Office space
Industrial property in Slangerup, North Zealand
 More info
Industrial property in Slangerup, North Zealand
Industrial property for rent in Slangerup, North Zealand
Areal
Ca. 170 m2
Pris pr. md.
Ca. 8,800 DKK pr md
Område
Slangerup, North Zealand
Type
Industrial property
Industrial property in Slangerup, North Zealand
 More info
Industrial property in Slangerup, North Zealand
Industrial property for rent in Slangerup, North Zealand
Areal
Ca. 170 m2
Pris pr. md.
Ca. 8,800 DKK pr md
Område
Slangerup, North Zealand
Type
Industrial property
Industrial property in Zwolle, Overijssel
 More info
Industrial property in Zwolle, Overijssel
Industrial property for sale in Zwolle, Overijssel
Areal
Ca. 60 m2
Pris
Ca. 140,000EUR
Område
Zwolle, Overijssel
Type
Industrial property
Warehouse in Hvidovre, Greater Copenhagen
 More info
Warehouse in Hvidovre, Greater Copenhagen
Warehouse for rent in Hvidovre, Greater Copenhagen
Areal
Ca. 895 m2
Pris pr. md.
Ca. 55,800 DKK pr md
Område
Hvidovre, Greater Copenhagen
Type
Warehouse
Office space in Ishøj, Greater Copenhagen
 More info
Office space in Ishøj, Greater Copenhagen
Office space for rent in Ishøj, Greater Copenhagen
Areal
Ca. 2,065 m2
Pris pr. md.
Ca. 146,250 DKK pr md
Område
Ishøj, Greater Copenhagen
Type
Office space
Warehouse in Rødekro, Region of Southern Denmark
 More info
Warehouse in Rødekro, Region of Southern Denmark
Warehouse for rent in Rødekro, Region of Southern Denmark
Areal
Ca. 1,815 m2
Pris pr. md.
Ca. 75,600 DKK pr md
Område
Rødekro, Region of Southern Denmark
Type
Warehouse
Warehouse in Copenhagen SV, Copenhagen
 More info
Warehouse in Copenhagen SV, Copenhagen
Warehouse for rent in Copenhagen SV, Copenhagen
Areal
Ca. 100 m2
Pris pr. md.
Ca. 11,850 DKK pr md
Område
Copenhagen SV, Copenhagen
Type
Warehouse
Warehouse in Roslev, Central Jutland Region
 More info
Warehouse in Roslev, Central Jutland Region
Warehouse for rent in Roslev, Central Jutland Region
Areal
Ca. 1,945 m2
Pris pr. md.
Ca. 34,100 DKK pr md
Område
Roslev, Central Jutland Region
Type
Warehouse
Warehouse in Fredensborg, North Zealand
 More info
Warehouse in Fredensborg, North Zealand
Warehouse for rent in Fredensborg, North Zealand
Areal
Ca. 475 m2
Pris pr. md.
Ca. 13,850 DKK pr md
Område
Fredensborg, North Zealand
Type
Warehouse
Industrial property in Soest, Nordrhein-Westfalen
 More info
Industrial property in Soest, Nordrhein-Westfalen
Industrial property for rent in Soest, Nordrhein-Westfalen
Areal
Ca. 50 m2
Pris pr. md.
Ca. 560,000 EUR pr md
Område
Soest, Nordrhein-Westfalen
Type
Industrial property
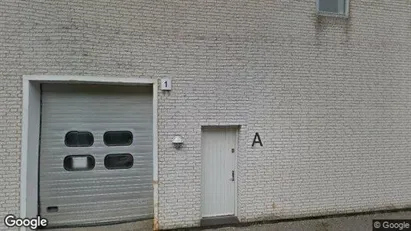
Industrial property in Store Fuglede, Region Zealand
 More info
Industrial property in Store Fuglede, Region Zealand
Industrial property for rent in Store Fuglede, Region Zealand
Areal
Ca. 70 m2
Pris pr. md.
Ca. 3,350 DKK pr md
Område
Store Fuglede, Region Zealand
Type
Industrial property
Selected customers
30,000 customers use Companyspace.com
30,000 customers
285,000 companies in our database
2,400 rentals annually
Companyspace.com is used by thousands of landlords, property companies, commercial real estate agents, investors and business centres seeking greater visibility, more enquiries and lower vacancy rates.


