


Industrial properties in Europe
Companyspace.com today:
New today 2,965
Updated 24h 3,033
Notifications about new companyspaces2,189
Copenhagen +6
Stockholm +10
Amsterdam +3
Berlin +3
Vienna +6
Paris +5
Madrid +4
Dublin (county) +23
Warsaw +19
Greater London +14
Latest update 2 h ago
Active ads 369,199
19,091 industrial properties found
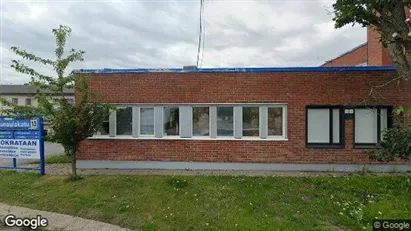
Industrial property in Pirkkala, Pirkanmaa
 More info
Industrial property in Pirkkala, Pirkanmaa
Industrial property for rent in Pirkkala, Pirkanmaa
Areal
-
Pris pr. md.
Ca. 2,450 EUR pr md
Område
Pirkkala, Pirkanmaa
Type
Industrial property
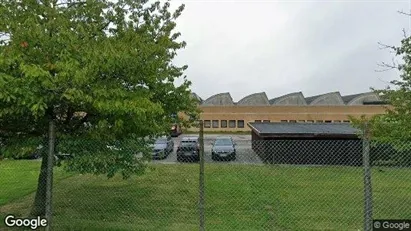
Industrial property in Pori, Satakunta
 More info
Industrial property in Pori, Satakunta
Industrial property for rent in Pori, Satakunta
Areal
Ca. 470 m2
Pris pr. md.
Ca. 2,900 EUR pr md
Område
Pori, Satakunta
Type
Industrial property
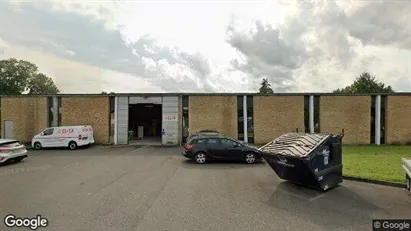
Warehouse in Vejle, Vejle (region)
 More info
Warehouse in Vejle, Vejle (region)
Warehouse for rent in Vejle, Vejle (region)
Areal
Ca. 1,200 m2
Pris pr. md.
Ca. 37,100 DKK pr md
Område
Vejle, Vejle (region)
Type
Warehouse
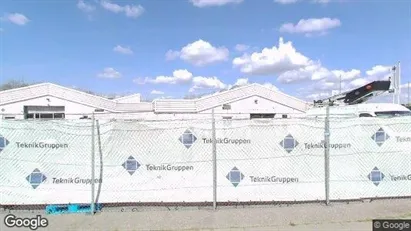
Warehouse in Hørning, Central Jutland Region
 More info
Warehouse in Hørning, Central Jutland Region
Warehouse for rent in Hørning, Central Jutland Region
Areal
Ca. 1,045 m2
Pris pr. md.
Ca. 25,000 DKK pr md
Område
Hørning, Central Jutland Region
Type
Warehouse
Office space in Vejle, Vejle (region)
 More info
Office space in Vejle, Vejle (region)
Office space for rent in Vejle, Vejle (region)
Areal
Ca. 500 m2
Pris pr. md.
Ca. 25,000 DKK pr md
Område
Vejle, Vejle (region)
Type
Office space
Warehouse in Herlev, Greater Copenhagen
 More info
Warehouse in Herlev, Greater Copenhagen
Warehouse for rent in Herlev, Greater Copenhagen
Areal
Ca. 850 m2
Pris pr. md.
Ca. 49,750 DKK pr md
Område
Herlev, Greater Copenhagen
Type
Warehouse
Warehouse in Odder, Central Jutland Region
 More info
Warehouse in Odder, Central Jutland Region
Warehouse for rent in Odder, Central Jutland Region
Areal
Ca. 170 m2
Pris pr. md.
Ca. 7,700 DKK pr md
Område
Odder, Central Jutland Region
Type
Warehouse
Warehouse in Odense NV, Odense
 More info
Warehouse in Odense NV, Odense
Warehouse for rent in Odense NV, Odense
Areal
Ca. 945 m2
Pris pr. md.
Ca. 40,000 DKK pr md
Område
Odense NV, Odense
Type
Warehouse
Warehouse in Odder, Central Jutland Region
 More info
Warehouse in Odder, Central Jutland Region
Warehouse for rent in Odder, Central Jutland Region
Areal
Ca. 360 m2
Pris pr. md.
Ca. 9,750 DKK pr md
Område
Odder, Central Jutland Region
Type
Warehouse
Warehouse in Vejen, Region of Southern Denmark
 More info
Warehouse in Vejen, Region of Southern Denmark
Warehouse for rent in Vejen, Region of Southern Denmark
Areal
Ca. 155 m2
Pris pr. md.
Not stated
Område
Vejen, Region of Southern Denmark
Type
Warehouse
Warehouse in Odense S, Odense
 More info
Warehouse in Odense S, Odense
Warehouse for rent in Odense S, Odense
Areal
Ca. 1,325 m2
Pris pr. md.
Ca. 33,150 DKK pr md
Område
Odense S, Odense
Type
Warehouse
Warehouse in Humlebæk, North Zealand
 More info
Warehouse in Humlebæk, North Zealand
Warehouse for rent in Humlebæk, North Zealand
Areal
Ca. 4,500 m2
Pris pr. md.
Ca. 228,750 DKK pr md
Område
Humlebæk, North Zealand
Type
Warehouse
Warehouse in Rødovre, Greater Copenhagen
 More info
Warehouse in Rødovre, Greater Copenhagen
Warehouse for rent in Rødovre, Greater Copenhagen
Areal
Ca. 200 m2
Pris pr. md.
Ca. 20,000 DKK pr md
Område
Rødovre, Greater Copenhagen
Type
Warehouse
Warehouse in Hørning, Central Jutland Region
 More info
Warehouse in Hørning, Central Jutland Region
Warehouse for rent in Hørning, Central Jutland Region
Areal
Ca. 865 m2
Pris pr. md.
Ca. 62,200 DKK pr md
Område
Hørning, Central Jutland Region
Type
Warehouse
Office space in Terndrup, North Jutland Region
 More info
Office space in Terndrup, North Jutland Region
Office space for rent in Terndrup, North Jutland Region
Areal
Ca. 175 m2
Pris pr. md.
Ca. 6,500 DKK pr md
Område
Terndrup, North Jutland Region
Type
Office space
Warehouse in Hasselager, Aarhus
 More info
Warehouse in Hasselager, Aarhus
Warehouse for rent in Hasselager, Aarhus
Areal
Ca. 145 m2
Pris pr. md.
Ca. 9,900 DKK pr md
Område
Hasselager, Aarhus
Type
Warehouse
Warehouse in Hinnerup, Central Jutland Region
 More info
Warehouse in Hinnerup, Central Jutland Region
Warehouse for rent in Hinnerup, Central Jutland Region
Areal
Ca. 400 m2
Pris pr. md.
Ca. 6,500 DKK pr md
Område
Hinnerup, Central Jutland Region
Type
Warehouse
Warehouse in Greve, Greater Copenhagen
 More info
Warehouse in Greve, Greater Copenhagen
Warehouse for rent in Greve, Greater Copenhagen
Areal
Ca. 700 m2
Pris pr. md.
Ca. 35,400 DKK pr md
Område
Greve, Greater Copenhagen
Type
Warehouse
Selected customers
30,000 customers use Companyspace.com
30,000 customers
285,000 companies in our database
2,400 rentals annually
Companyspace.com is used by thousands of landlords, property companies, commercial real estate agents, investors and business centres seeking greater visibility, more enquiries and lower vacancy rates.


