


Industrial properties in Europe
Companyspace.com today:
New today 2,965
Updated 24h 3,039
Notifications about new companyspaces2,189
Copenhagen +6
Stockholm +10
Amsterdam +3
Berlin +3
Vienna +6
Paris +5
Madrid +4
Dublin (county) +23
Warsaw +19
Greater London +14
Latest update 2 h ago
Active ads 369,199
19,091 industrial properties found
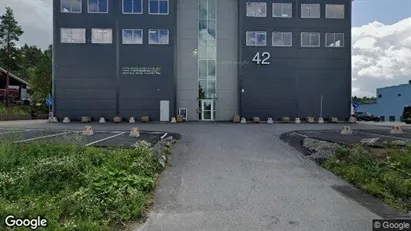
Industrial property in Huddinge, Stockholm County
 More info
Industrial property in Huddinge, Stockholm County
Industrial property for rent in Huddinge, Stockholm County
Areal
Ca. 50 m2
Pris pr. md.
Ca. 5,500 SEK pr md
Område
Huddinge, Stockholm County
Type
Industrial property
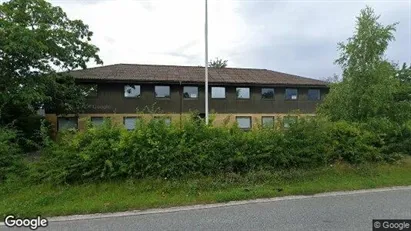
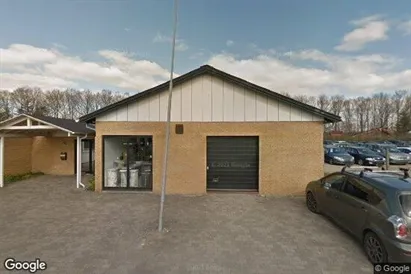
Warehouse in Skanderborg, Central Jutland Region
 More info
Warehouse in Skanderborg, Central Jutland Region
Warehouse for rent in Skanderborg, Central Jutland Region
Areal
Ca. 135 m2
Pris pr. md.
Ca. 4,500 DKK pr md
Område
Skanderborg, Central Jutland Region
Type
Warehouse
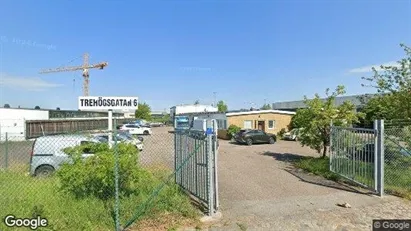
Warehouse in Ullerslev, Funen
 More info
Warehouse in Ullerslev, Funen
Warehouse for rent in Ullerslev, Funen
Areal
Ca. 2,000 m2
Pris pr. md.
Ca. 49,150 DKK pr md
Område
Ullerslev, Funen
Type
Warehouse
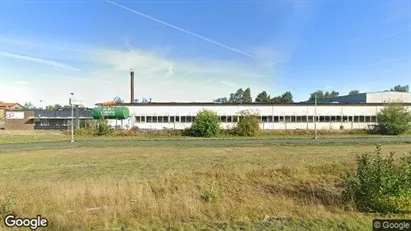
Industrial property in Farum, North Zealand
 More info
Industrial property in Farum, North Zealand
Industrial property for rent in Farum, North Zealand
Areal
Ca. 1,100 m2
Pris pr. md.
Ca. 55,000 DKK pr md
Område
Farum, North Zealand
Type
Industrial property
Industrial property in Taastrup, Greater Copenhagen
 More info
Industrial property in Taastrup, Greater Copenhagen
Industrial property for rent in Taastrup, Greater Copenhagen
Areal
Ca. 415 m2
Pris pr. md.
Ca. 28,000 DKK pr md
Område
Taastrup, Greater Copenhagen
Type
Industrial property
Industrial property in Botkyrka, Stockholm County
 More info
Industrial property in Botkyrka, Stockholm County
Industrial property for rent in Botkyrka, Stockholm County
Areal
Ca. 460 m2
Pris pr. md.
Ca. 1,350 SEK pr md
Område
Botkyrka, Stockholm County
Type
Industrial property
Industrial property in Kil, Värmland County
 More info
Industrial property in Kil, Värmland County
Industrial property for rent in Kil, Värmland County
Areal
140 - 1,050 m2
Pris pr. md.
Ca. 59,150 SEK pr md
Område
Kil, Värmland County
Type
Industrial property
Industrial property in Svendborg, Funen
 More info
Industrial property in Svendborg, Funen
Industrial property for rent in Svendborg, Funen
Areal
Ca. 660 m2
Pris pr. md.
Ca. 30,000 DKK pr md
Område
Svendborg, Funen
Type
Industrial property
Coworking space in Gilleleje, North Zealand
 More info
Coworking space in Gilleleje, North Zealand
Coworking space for rent in Gilleleje, North Zealand
Areal
8 - 1,500 m2
Pris pr. md.
Ca. 20,000 DKK pr md
Område
Gilleleje, North Zealand
Type
Coworking space
Industrial property in Fosie, Malmö
 More info
Industrial property in Fosie, Malmö
Industrial property for rent in Fosie, Malmö
Areal
400 - 860 m2
Pris pr. md.
Ca. 71,650 SEK pr md
Område
Fosie, Malmö
Type
Industrial property
Warehouse in Odense C, Odense
 More info
Warehouse in Odense C, Odense
Warehouse for rent in Odense C, Odense
Areal
Ca. 25 m2
Pris pr. md.
Ca. 1,500 DKK pr md
Område
Odense C, Odense
Type
Warehouse
Industrial property in Kävlinge, Skåne County
 More info
Industrial property in Kävlinge, Skåne County
Industrial property for rent in Kävlinge, Skåne County
Areal
Ca. 1,000 m2
Pris pr. md.
Ca. 40,000 SEK pr md
Område
Kävlinge, Skåne County
Type
Industrial property
Industrial property in Odense SØ, Odense
 More info
Industrial property in Odense SØ, Odense
Industrial property for rent in Odense SØ, Odense
Areal
Ca. 1,195 m2
Pris pr. md.
Ca. 47,200 DKK pr md
Område
Odense SØ, Odense
Type
Industrial property
Industrial property in Snertinge, Region Zealand
 More info
Industrial property in Snertinge, Region Zealand
Industrial property for rent in Snertinge, Region Zealand
Areal
Ca. 300 m2
Pris pr. md.
Ca. 7,000 DKK pr md
Område
Snertinge, Region Zealand
Type
Industrial property
Industrial property in Huddinge, Stockholm County
 More info
Industrial property in Huddinge, Stockholm County
Industrial property for rent in Huddinge, Stockholm County
Areal
Ca. 305 m2
Pris pr. md.
Ca. 32,350 SEK pr md
Område
Huddinge, Stockholm County
Type
Industrial property
Industrial property in Randers NV, Randers
 More info
Industrial property in Randers NV, Randers
Industrial property for rent in Randers NV, Randers
Areal
500 - 6,000 m2
Pris pr. md.
Ca. 175,000 DKK pr md
Område
Randers NV, Randers
Type
Industrial property
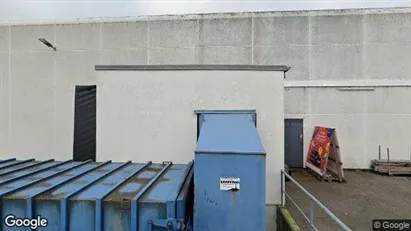
Warehouse in Ringsted, Region Zealand
 More info
Warehouse in Ringsted, Region Zealand
Warehouse for rent in Ringsted, Region Zealand
Areal
Ca. 300 m2
Pris pr. md.
Not stated
Område
Ringsted, Region Zealand
Type
Warehouse
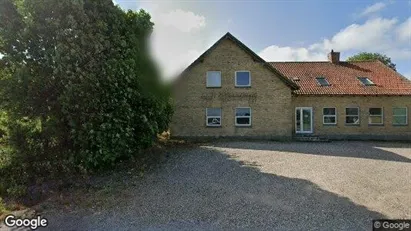
Office space in Skanderborg, Central Jutland Region
 More info
Office space in Skanderborg, Central Jutland Region
Office space for rent in Skanderborg, Central Jutland Region
Areal
-
Pris pr. md.
Ca. 22,900 DKK pr md
Område
Skanderborg, Central Jutland Region
Type
Office space
Selected customers
30,000 customers use Companyspace.com
30,000 customers
285,000 companies in our database
2,400 rentals annually
Companyspace.com is used by thousands of landlords, property companies, commercial real estate agents, investors and business centres seeking greater visibility, more enquiries and lower vacancy rates.


