


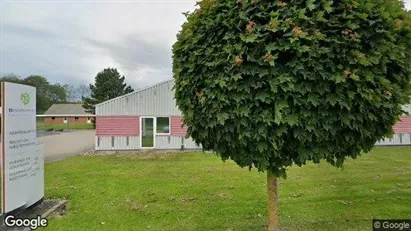
Photo provided by Google Street View and may be inaccurate:
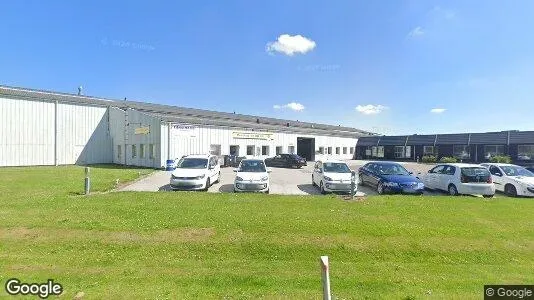

Industrial property for rent, Randers NV, Randers, Hovedevejen 8
- 500 - 6,000 m2
- Ca. 175,000 DKK per month
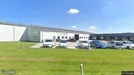
Industrial property for rent, Randers NV, Randers, Hovedevejen 8

500 - 6,000m2

Industrial property

Randers NV, Randers
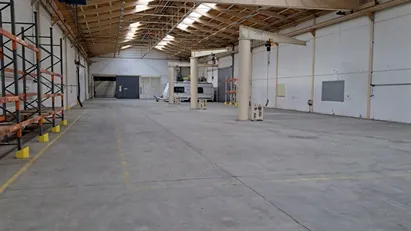
Facts about the premises
- 26.03.2026
- 3467530
- Industrial property
- 500 - 6,000 m2
- Ca. 350 DKK
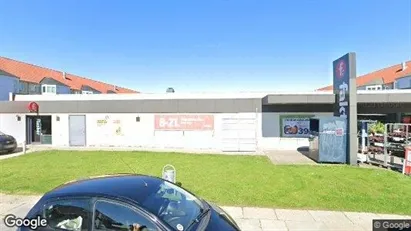
Similar premises
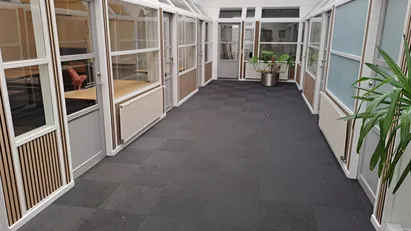
Industrial property in Randers NV, Randers
 More info
Industrial property in Randers NV, Randers
Industrial property for rent in Randers NV, Randers
Areal
500 - 6,000 m2
Pris pr. md.
Ca. 175,000 DKK pr md
Område
Randers NV, Randers
Type
Industrial property
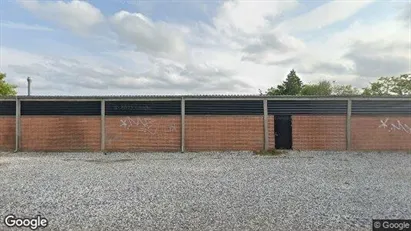
Industrial property in Randers NV, Randers
 More info
Industrial property in Randers NV, Randers
Industrial property for rent in Randers NV, Randers
Areal
20 - 7,000 m2
Pris pr. md.
Ca. 204,150 DKK pr md
Område
Randers NV, Randers
Type
Industrial property
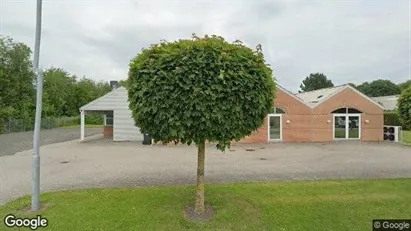
Warehouse in Randers NV, Randers
 More info
Warehouse in Randers NV, Randers
Warehouse for rent in Randers NV, Randers
Areal
Ca. 875 m2
Pris pr. md.
Ca. 29,000 DKK pr md
Område
Randers NV, Randers
Type
Warehouse
Warehouse in Randers NV, Randers
 More info
Warehouse in Randers NV, Randers
Warehouse for rent in Randers NV, Randers
Areal
Ca. 360 m2
Pris pr. md.
Ca. 14,500 DKK pr md
Område
Randers NV, Randers
Type
Warehouse
Warehouse in Randers NV, Randers
 More info
Warehouse in Randers NV, Randers
Warehouse for rent in Randers NV, Randers
Areal
Ca. 2,135 m2
Pris pr. md.
Ca. 60,000 DKK pr md
Område
Randers NV, Randers
Type
Warehouse
Commercial space in Randers NV, Randers
 More info
Commercial space in Randers NV, Randers
Commercial space for rent in Randers NV, Randers
Areal
Ca. 875 m2
Pris pr. md.
Ca. 74,800 DKK pr md
Område
Randers NV, Randers
Type
Commercial property
Warehouse in Randers NV, Randers
 More info
Warehouse in Randers NV, Randers
Warehouse for rent in Randers NV, Randers
Areal
-
Pris pr. md.
Not stated
Område
Randers NV, Randers
Type
Warehouse
Office space in Randers NV, Randers
 More info
Office space in Randers NV, Randers
Office space for rent in Randers NV, Randers
Areal
Ca. 85 m2
Pris pr. md.
Ca. 6,000 DKK pr md
Område
Randers NV, Randers
Type
Office space
Office space in Randers NV, Randers
 More info
Office space in Randers NV, Randers
Office space for rent in Randers NV, Randers
Areal
Ca. 715 m2
Pris pr. md.
Ca. 33,000 DKK pr md
Område
Randers NV, Randers
Type
Office space
Selected customers
30,000 customers use Companyspace.com
30,000 customers
285,000 companies in our database
2,400 rentals annually
Companyspace.com is used by thousands of landlords, property companies, commercial real estate agents, investors and business centres seeking greater visibility, more enquiries and lower vacancy rates.


