Fabriks bygning 29 kr kvm/måneden
Lager til leje i 8920 Randers NV
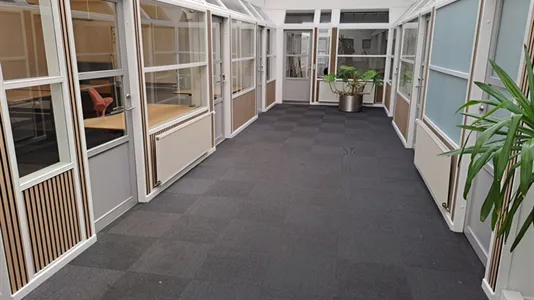
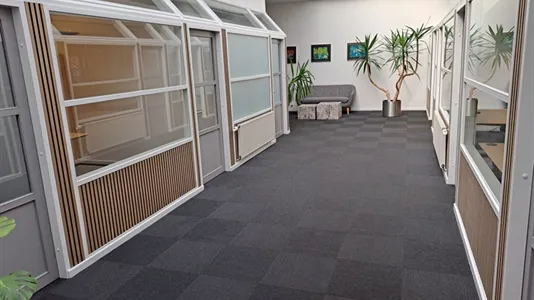
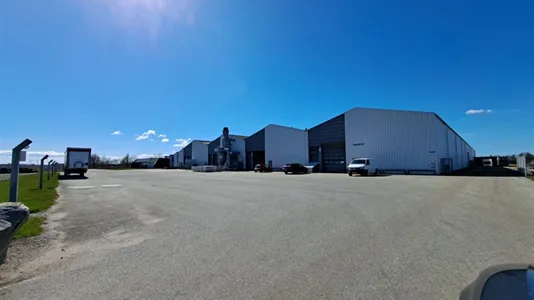
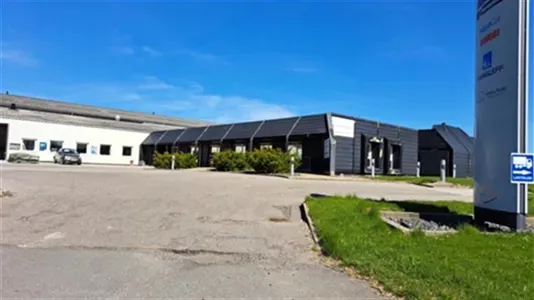
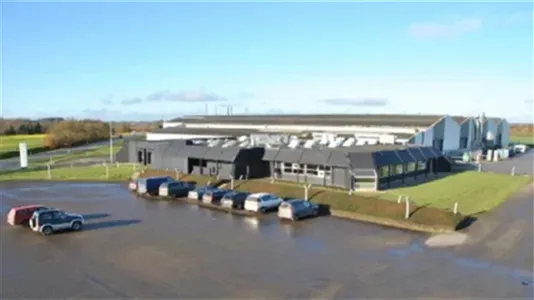
Erhvervscenter Randers Nord råder ud over vores kontorhotel over i alt 7000 m2 produktions – og lagerfaciliteter, som udlejes til konkurrencedygtige priser. Faciliteterne fås med og uden tilhørende kontorpladser, adgang til mødefaciliteter og fællesfaciliteter.
Erhvervslejemål med plads
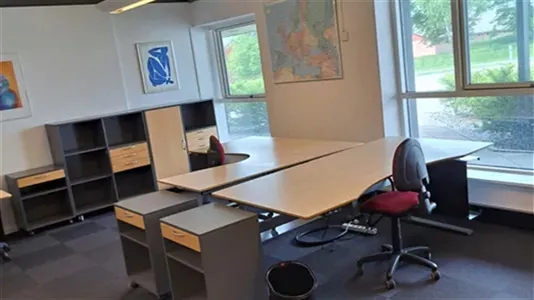
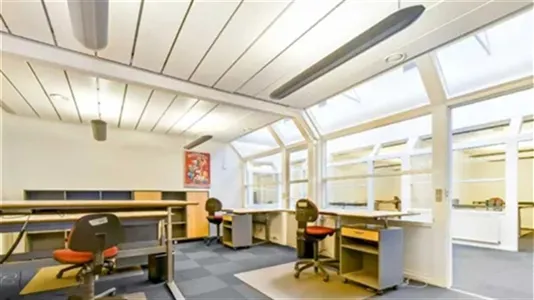
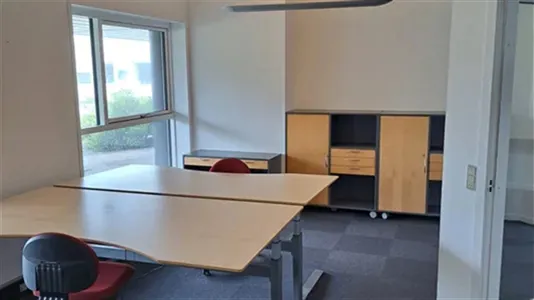
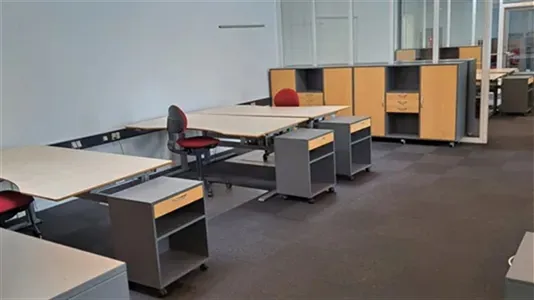
Kontor lokaler fra 20 kvm op til 1000 kvm
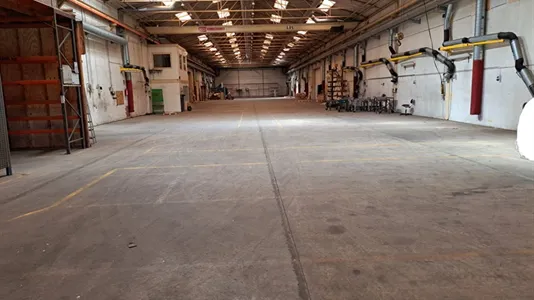
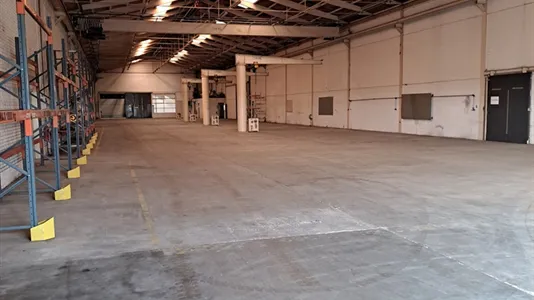
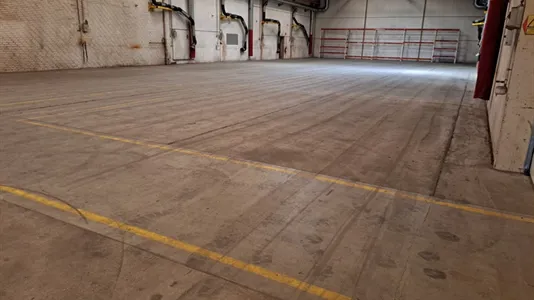
Hal 1, 1350 m2 med en 5 ton kran
Hal 2, 1650 m2 med 2 stk 5t ton kran og svejseudsugning
Hal 3, 1850 m2 med 1stk 5 ton kran og 3 stk 1 ton 360 graders kran
Det er en stor beslutning at binde sig til et erhvervslejemål, så derfor har vi sørget for lidt hjælp til dig. Så, hvis du stadig er i tvivl om, hvorvidt en plads hos Erhvervscenter Randers Nord er en god ide, så er der her TI GODE GRUNDE til at vælge os…
1. Billig leje
2. 24/7 adgang
3. Professionel firma adresse
4. Trådløs højhastigheds fibernet
5. Kontor med mulighed for tilknyttet lager – perfekt til nystartede webshops
6. Sikring/ alarm i hele huset
7. Gratis parkering
8. Adgang til mødelokaler
9. Kort afstand til motorvej (under 5 minutter)
10. En perfekt mulighed for at danne netværk
Kontakt os endelig, hvis du ønsker at høre mere om mulighederne for, at flytte ind i et af vores kontorer eller bygninger. Du får her et erhvervslejemål med muligheder og rummelighed. Som lejer i Erhvervscenter Randers Nord bliver du en del af et forretningsmiljø, som allerede huser en lang række iværksætter – og vækstvirksomheder, der arbejder inden for en bred vifte af forretningsområder, og som alle satser stort for at drive deres virksomheder mod succes. Vi ønsker at skabe et miljø hvor netværk, fællesskab og vidensdeling går hånd i hånd, og vores overskyggende formål er at skabe et rum, hvor ideer og forretninger kan vokse og udvikles. Fordelene ved et kontorfællesskab er mange. Først og fremmest er muligheden for at up – eller down size eftertragtet. Pladskravet kan for erhvervslejemål, som så meget andet hurtigt ændre sig. Hos os er der næsten altid mulighed for at følge med udviklingen. Send en mail eller giv et ring, og så tager vi en snak om mulighederne for netop DIN virksomhed.
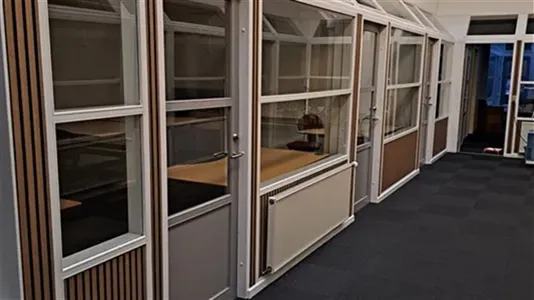
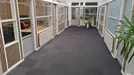
Kontorhotellet:
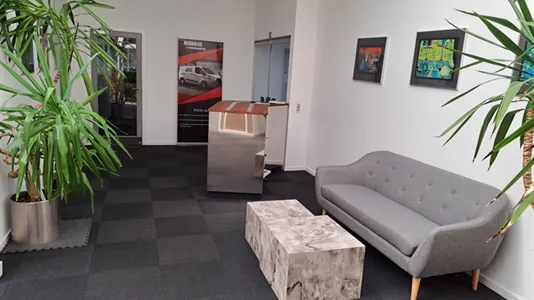
Kontorhotel i Erhvervscenter Randers Nord giver dig mulighed for, at blive en del af et professionelt forretningsmiljø, med plads til vækst og udvikling. Her kan du benytte dig at de mange faciliteter i huset, der blandt andet inkluderer trådløst højhastighedsinternet, mødelokaler, 24/7 adgang, alarm og gratis parkering lige udenfor døren. Med nem adgang til E-45 har hverken du eller dine kunder svært ved at komme frem til din plads i vores kontorhotel, og fra Randers centrum er der kun max. 10 minutter.
Erhvervscenter Randers Nord Kontor, produktions- og lagerlokaler lige op ad E-45 Kunne du tænke dig, at få en fremvisning eller høre mere om, hvilke muligheder der er for at blive en del af fællesskabet i Erhvervscenter Randers Nord? Vi har kapacitet til flere spændende virksomheder – vil du have en plads? Selvom vi allerede huser mange virksomheder, så har vi stadig kapacitet til at byde endnu flere virksomheder velkommen. Så driver du virksomhed hjemmefra, og bliver du motiveret af at være omgivet af andre dygtige iværksættere, så er vores kontorfællesskab helt sikkert noget for dig. Er du interesseret i at leje et af vores lokaler, hvad enten det er lager – og produktion, kontorlokaler eller blot en enkelt kontorplads? Så skriv eller ring til os på telefon: [xxxxx]og mail: [xxxxx]
Information og data
Dette lagerlejemål, som alternativt kan anvendes til Værksted eller Kontorhotel, ligger på Hovedvejen i Randers NV. Randers NV har postnummeret 8920, og ligger i kommunen Randers, som ligger i Randers. Lokalet er i alt 7000 m2.
Der er mulighed for udvidelse med ny byg eller grusplads.