


Industrial properties in Europe
Companyspace.com today:
New today 2,965
Updated 24h 2,971
Notifications about new companyspaces2,189
Copenhagen +6
Stockholm +10
Amsterdam +3
Berlin +3
Vienna +6
Paris +5
Madrid +4
Dublin (county) +23
Warsaw +19
Greater London +14
Latest update 3 h ago
Active ads 369,199
19,091 industrial properties found
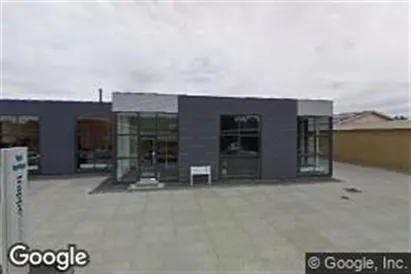
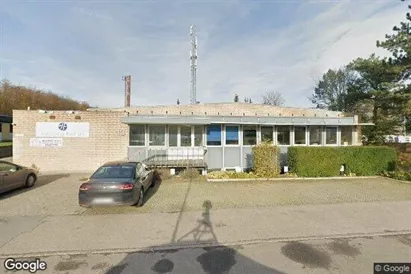
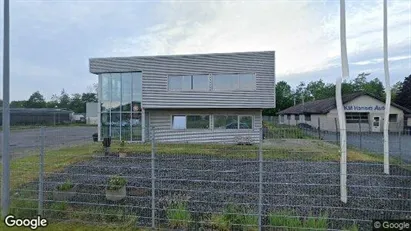
Industrial property in Ølgod, Region of Southern Denmark
 More info
Industrial property in Ølgod, Region of Southern Denmark
Industrial property for rent in Ølgod, Region of Southern Denmark
Areal
100 - 4,000 m2
Pris pr. md.
Ca. 8,350 DKK pr md
Område
Ølgod, Region of Southern Denmark
Type
Industrial property
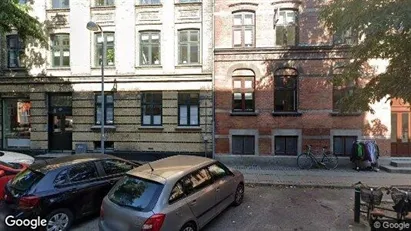
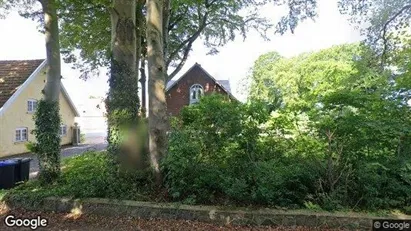
Industrial property in Hvidovre, Greater Copenhagen
 More info
Industrial property in Hvidovre, Greater Copenhagen
Industrial property for rent in Hvidovre, Greater Copenhagen
Areal
Ca. 100 m2
Pris pr. md.
Ca. 12,000 DKK pr md
Område
Hvidovre, Greater Copenhagen
Type
Industrial property
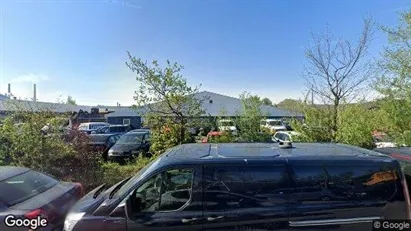
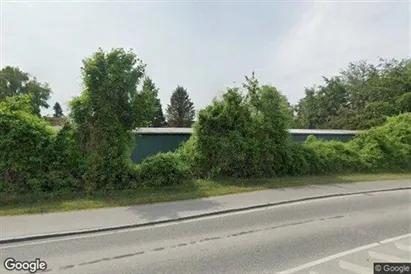
Industrial property in Gothenburg East, Gothenburg
 More info
Industrial property in Gothenburg East, Gothenburg
Industrial property for rent in Gothenburg East, Gothenburg
Areal
Ca. 450 m2
Pris pr. md.
Ca. 30,000 SEK pr md
Område
Gothenburg East, Gothenburg
Type
Industrial property
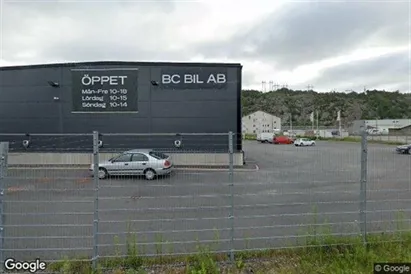
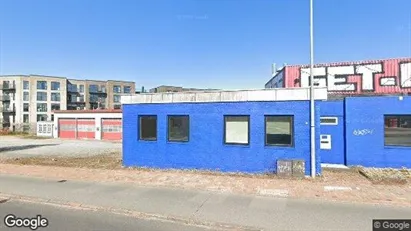
Industrial property in Gothenburg East, Gothenburg
 More info
Industrial property in Gothenburg East, Gothenburg
Industrial property for rent in Gothenburg East, Gothenburg
Areal
400 - 800 m2
Pris pr. md.
Ca. 119,000 SEK pr md
Område
Gothenburg East, Gothenburg
Type
Industrial property
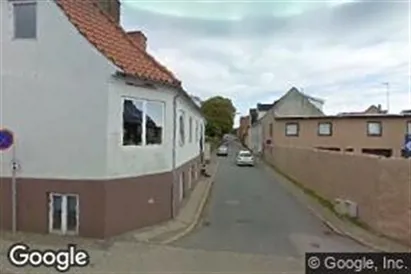
Warehouse in Thisted, North Jutland Region
 More info
Warehouse in Thisted, North Jutland Region
Warehouse for rent in Thisted, North Jutland Region
Areal
Ca. 100 m2
Pris pr. md.
Ca. 2,000 DKK pr md
Område
Thisted, North Jutland Region
Type
Warehouse
Warehouse in Kjellerup, Central Jutland Region
 More info
Warehouse in Kjellerup, Central Jutland Region
Warehouse for rent in Kjellerup, Central Jutland Region
Areal
23 - 45 m2
Pris pr. md.
Ca. 3,650 DKK pr md
Område
Kjellerup, Central Jutland Region
Type
Warehouse
Industrial property in Hedehusene, Greater Copenhagen
 More info
Industrial property in Hedehusene, Greater Copenhagen
Industrial property for rent in Hedehusene, Greater Copenhagen
Areal
Ca. 60 m2
Pris pr. md.
Ca. 2,750 DKK pr md
Område
Hedehusene, Greater Copenhagen
Type
Industrial property
Industrial property in Vissenbjerg, Funen
 More info
Industrial property in Vissenbjerg, Funen
Industrial property for rent in Vissenbjerg, Funen
Areal
Ca. 3,150 m2
Pris pr. md.
Ca. 91,900 DKK pr md
Område
Vissenbjerg, Funen
Type
Industrial property
Warehouse in Brøndby, Greater Copenhagen
 More info
Warehouse in Brøndby, Greater Copenhagen
Warehouse for rent in Brøndby, Greater Copenhagen
Areal
Ca. 85 m2
Pris pr. md.
Not stated
Område
Brøndby, Greater Copenhagen
Type
Warehouse
Industrial property in Frederiksberg, Copenhagen
 More info
Industrial property in Frederiksberg, Copenhagen
Industrial property for rent in Frederiksberg, Copenhagen
Areal
Ca. 20 m2
Pris pr. md.
Ca. 3,150 DKK pr md
Område
Frederiksberg, Copenhagen
Type
Industrial property
Industrial property in Sakskøbing, Region Zealand
 More info
Industrial property in Sakskøbing, Region Zealand
Industrial property for rent in Sakskøbing, Region Zealand
Areal
Ca. 500 m2
Pris pr. md.
Ca. 12,500 DKK pr md
Område
Sakskøbing, Region Zealand
Type
Industrial property
Industrial property in Lille Skensved, Region Zealand
 More info
Industrial property in Lille Skensved, Region Zealand
Industrial property for rent in Lille Skensved, Region Zealand
Areal
Ca. 90 m2
Pris pr. md.
Ca. 4,900 DKK pr md
Område
Lille Skensved, Region Zealand
Type
Industrial property
Industrial property in Odense C, Odense
 More info
Industrial property in Odense C, Odense
Industrial property for rent in Odense C, Odense
Areal
Ca. 55 m2
Pris pr. md.
Ca. 1,900 DKK pr md
Område
Odense C, Odense
Type
Industrial property
Warehouse in Hvidovre, Greater Copenhagen
 More info
Warehouse in Hvidovre, Greater Copenhagen
Warehouse for rent in Hvidovre, Greater Copenhagen
Areal
Ca. 15 m2
Pris pr. md.
Ca. 1,500 DKK pr md
Område
Hvidovre, Greater Copenhagen
Type
Warehouse
Industrial property in Lille Skensved, Region Zealand
 More info
Industrial property in Lille Skensved, Region Zealand
Industrial property for rent in Lille Skensved, Region Zealand
Areal
Ca. 90 m2
Pris pr. md.
Ca. 4,900 DKK pr md
Område
Lille Skensved, Region Zealand
Type
Industrial property
Warehouse in Gistrup, Aalborg (region)
 More info
Warehouse in Gistrup, Aalborg (region)
Warehouse for rent in Gistrup, Aalborg (region)
Areal
Ca. 75 m2
Pris pr. md.
Not stated
Område
Gistrup, Aalborg (region)
Type
Warehouse
Warehouse in Søndersø, Funen
 More info
Warehouse in Søndersø, Funen
Warehouse for rent in Søndersø, Funen
Areal
Ca. 1,000 m2
Pris pr. md.
Ca. 10,000 DKK pr md
Område
Søndersø, Funen
Type
Warehouse
Industrial property in Ullerslev, Funen
 More info
Industrial property in Ullerslev, Funen
Industrial property for rent in Ullerslev, Funen
Areal
Ca. 2,000 m2
Pris pr. md.
Ca. 49,150 DKK pr md
Område
Ullerslev, Funen
Type
Industrial property
Selected customers
30,000 customers use Companyspace.com
30,000 customers
285,000 companies in our database
2,400 rentals annually
Companyspace.com is used by thousands of landlords, property companies, commercial real estate agents, investors and business centres seeking greater visibility, more enquiries and lower vacancy rates.


