


Industrial properties in Europe
Companyspace.com today:
New today 2,965
Updated 24h 3,039
Notifications about new companyspaces2,189
Copenhagen +6
Stockholm +10
Amsterdam +3
Berlin +3
Vienna +6
Paris +5
Madrid +4
Dublin (county) +23
Warsaw +19
Greater London +14
Latest update 2 h ago
Active ads 369,199
19,091 industrial properties found
Industrial property in Dublin 11, Dublin
 More info
Industrial property in Dublin 11, Dublin
Industrial property for rent in Dublin 11, Dublin
Areal
Ca. 30 m2
Pris pr. md.
Ca. 550 EUR pr md
Område
Dublin 11, Dublin
Type
Industrial property
Warehouse in Aarhus V, Aarhus
 More info
Warehouse in Aarhus V, Aarhus
Warehouse for rent in Aarhus V, Aarhus
Areal
Ca. 1,435 m2
Pris pr. md.
Ca. 76,800 DKK pr md
Område
Aarhus V, Aarhus
Type
Warehouse
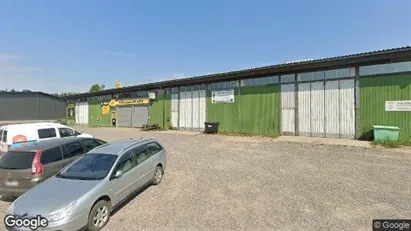
Warehouse in Kalundborg, Region Zealand
 More info
Warehouse in Kalundborg, Region Zealand
Warehouse for rent in Kalundborg, Region Zealand
Areal
Ca. 350 m2
Pris pr. md.
Ca. 14,000 DKK pr md
Område
Kalundborg, Region Zealand
Type
Warehouse
Industrial property in Dublin 5, Dublin
 More info
Industrial property in Dublin 5, Dublin
Industrial property for rent in Dublin 5, Dublin
Areal
Ca. 100 m2
Pris pr. md.
Ca. 2,500 EUR pr md
Område
Dublin 5, Dublin
Type
Industrial property
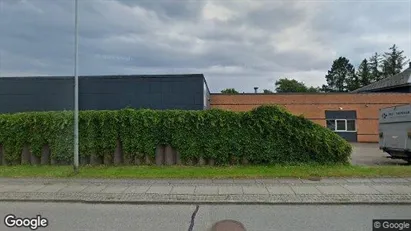
Warehouse in Hadsten, Central Jutland Region
 More info
Warehouse in Hadsten, Central Jutland Region
Warehouse for rent in Hadsten, Central Jutland Region
Areal
Ca. 485 m2
Pris pr. md.
Ca. 15,000 DKK pr md
Område
Hadsten, Central Jutland Region
Type
Warehouse
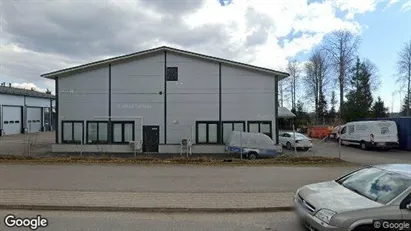
Industrial property in Hollola, Päijät-Häme
 More info
Industrial property in Hollola, Päijät-Häme
Industrial property for rent in Hollola, Päijät-Häme
Areal
-
Pris pr. md.
Ca. 132,000 EUR pr md
Område
Hollola, Päijät-Häme
Type
Industrial property
Industrial property in Hollola, Päijät-Häme
 More info
Industrial property in Hollola, Päijät-Häme
Industrial property for rent in Hollola, Päijät-Häme
Areal
-
Pris pr. md.
Ca. 160,000 EUR pr md
Område
Hollola, Päijät-Häme
Type
Industrial property
Warehouse in Åbyhøj, Aarhus
 More info
Warehouse in Åbyhøj, Aarhus
Warehouse for rent in Åbyhøj, Aarhus
Areal
Ca. 1,110 m2
Pris pr. md.
Ca. 44,000 DKK pr md
Område
Åbyhøj, Aarhus
Type
Warehouse
Industrial property in Dublin 3, Dublin
 More info
Industrial property in Dublin 3, Dublin
Industrial property for rent in Dublin 3, Dublin
Areal
Ca. 20 m2
Pris pr. md.
Ca. 950 EUR pr md
Område
Dublin 3, Dublin
Type
Industrial property
Warehouse in Risskov, Aarhus
 More info
Warehouse in Risskov, Aarhus
Warehouse for rent in Risskov, Aarhus
Areal
Ca. 705 m2
Pris pr. md.
Ca. 32,400 DKK pr md
Område
Risskov, Aarhus
Type
Warehouse
Industrial property in Dublin 11, Dublin
 More info
Industrial property in Dublin 11, Dublin
Industrial property for rent in Dublin 11, Dublin
Areal
Ca. 745 m2
Pris pr. md.
Ca. 7,500 EUR pr md
Område
Dublin 11, Dublin
Type
Industrial property
Industrial property in Farum, North Zealand
 More info
Industrial property in Farum, North Zealand
Industrial property for rent in Farum, North Zealand
Areal
Ca. 350 m2
Pris pr. md.
Ca. 21,900 DKK pr md
Område
Farum, North Zealand
Type
Industrial property
Industrial property in Lahti, Päijät-Häme
 More info
Industrial property in Lahti, Päijät-Häme
Industrial property for rent in Lahti, Päijät-Häme
Areal
Ca. 185 m2
Pris pr. md.
Ca. 900 EUR pr md
Område
Lahti, Päijät-Häme
Type
Industrial property
Industrial property in Lahti, Päijät-Häme
 More info
Industrial property in Lahti, Päijät-Häme
Industrial property for rent in Lahti, Päijät-Häme
Areal
Ca. 235 m2
Pris pr. md.
Ca. 1,200 EUR pr md
Område
Lahti, Päijät-Häme
Type
Industrial property
Industrial property in Tuusula, Uusimaa
 More info
Industrial property in Tuusula, Uusimaa
Industrial property for rent in Tuusula, Uusimaa
Areal
Ca. 100 m2
Pris pr. md.
Ca. 1,000 EUR pr md
Område
Tuusula, Uusimaa
Type
Industrial property
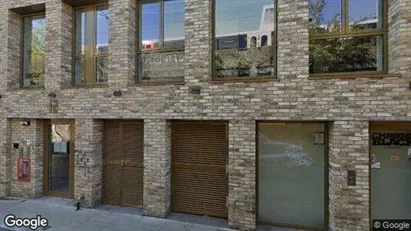
Warehouse in London E8, Greater London
 More info
Warehouse in London E8, Greater London
Warehouse for rent in London E8, Greater London
Areal
Ca. 165 m2
Pris pr. md.
Ca. 3,000 GBP pr md
Område
London E8, Greater London
Type
Warehouse
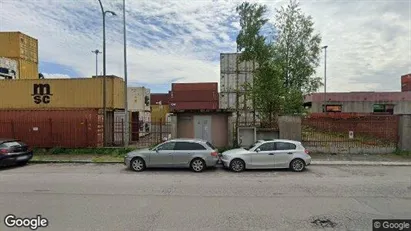
Real estate land in Pioltello, Lombardia
 More info
Real estate land in Pioltello, Lombardia
Land for sale in Pioltello, Lombardia
Areal
Ca. 5,510 m2
Pris
Ca. 1,680,000EUR
Område
Pioltello, Lombardia
Type
Land
Office space in Kluisbergen, Oost-Vlaanderen
 More info
Office space in Kluisbergen, Oost-Vlaanderen
Office space for rent in Kluisbergen, Oost-Vlaanderen
Areal
Ca. 165 m2
Pris pr. md.
Ca. 1,900 EUR pr md
Område
Kluisbergen, Oost-Vlaanderen
Type
Office space
Selected customers
30,000 customers use Companyspace.com
30,000 customers
285,000 companies in our database
2,400 rentals annually
Companyspace.com is used by thousands of landlords, property companies, commercial real estate agents, investors and business centres seeking greater visibility, more enquiries and lower vacancy rates.


