


Industrial properties in Europe
Companyspace.com today:
New today 2,965
Updated 24h 3,039
Notifications about new companyspaces2,189
Copenhagen +6
Stockholm +10
Amsterdam +3
Berlin +3
Vienna +6
Paris +5
Madrid +4
Dublin (county) +23
Warsaw +19
Greater London +14
Latest update 2 h ago
Active ads 369,199
19,091 industrial properties found
Office space in Hvidovre, Greater Copenhagen
 More info
Office space in Hvidovre, Greater Copenhagen
Office space for rent in Hvidovre, Greater Copenhagen
Areal
Ca. 1,575 m2
Pris pr. md.
Ca. 111,550 DKK pr md
Område
Hvidovre, Greater Copenhagen
Type
Office space
Industrial property in Kirkkonummi, Uusimaa
 More info
Industrial property in Kirkkonummi, Uusimaa
Industrial property for rent in Kirkkonummi, Uusimaa
Areal
Ca. 75 m2
Pris pr. md.
Ca. 800 EUR pr md
Område
Kirkkonummi, Uusimaa
Type
Industrial property
Warehouse in Glostrup, Greater Copenhagen
More info
Warehouse in Glostrup, Greater Copenhagen
Warehouse for rent in Glostrup, Greater Copenhagen
Areal
Ca. 6,640 m2
Pris pr. md.
Ca. 339,050 DKK pr md
Område
Glostrup, Greater Copenhagen
Type
Warehouse
Warehouse in Glostrup, Greater Copenhagen
More info
Warehouse in Glostrup, Greater Copenhagen
Warehouse for rent in Glostrup, Greater Copenhagen
Areal
Ca. 2,850 m2
Pris pr. md.
Ca. 463,150 DKK pr md
Område
Glostrup, Greater Copenhagen
Type
Warehouse
Warehouse in Glostrup, Greater Copenhagen
More info
Warehouse in Glostrup, Greater Copenhagen
Warehouse for rent in Glostrup, Greater Copenhagen
Areal
Ca. 1,900 m2
Pris pr. md.
Ca. 308,750 DKK pr md
Område
Glostrup, Greater Copenhagen
Type
Warehouse
Warehouse in Glostrup, Greater Copenhagen
More info
Warehouse in Glostrup, Greater Copenhagen
Warehouse for rent in Glostrup, Greater Copenhagen
Areal
Ca. 5,950 m2
Pris pr. md.
Ca. 154,400 DKK pr md
Område
Glostrup, Greater Copenhagen
Type
Warehouse
Warehouse in Glostrup, Greater Copenhagen
More info
Warehouse in Glostrup, Greater Copenhagen
Warehouse for rent in Glostrup, Greater Copenhagen
Areal
Ca. 13,285 m2
Pris pr. md.
Ca. 678,100 DKK pr md
Område
Glostrup, Greater Copenhagen
Type
Warehouse
Warehouse in Glostrup, Greater Copenhagen
More info
Warehouse in Glostrup, Greater Copenhagen
Warehouse for rent in Glostrup, Greater Copenhagen
Areal
Ca. 9,960 m2
Pris pr. md.
Ca. 508,550 DKK pr md
Område
Glostrup, Greater Copenhagen
Type
Warehouse
Industrial property in Hillerød, North Zealand
More info
Industrial property in Hillerød, North Zealand
Industrial property for rent in Hillerød, North Zealand
Areal
Ca. 230 m2
Pris pr. md.
Ca. 18,200 DKK pr md
Område
Hillerød, North Zealand
Type
Industrial property
Warehouse in Glostrup, Greater Copenhagen
More info
Warehouse in Glostrup, Greater Copenhagen
Warehouse for rent in Glostrup, Greater Copenhagen
Areal
Ca. 3,800 m2
Pris pr. md.
Ca. 617,500 DKK pr md
Område
Glostrup, Greater Copenhagen
Type
Warehouse
Warehouse in Glostrup, Greater Copenhagen
More info
Warehouse in Glostrup, Greater Copenhagen
Warehouse for rent in Glostrup, Greater Copenhagen
Areal
Ca. 3,320 m2
Pris pr. md.
Ca. 169,500 DKK pr md
Område
Glostrup, Greater Copenhagen
Type
Warehouse
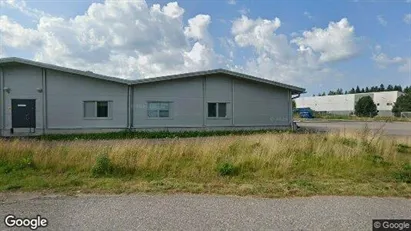
Industrial property in Riihimäki, Kanta-Häme
 More info
Industrial property in Riihimäki, Kanta-Häme
Industrial property for rent in Riihimäki, Kanta-Häme
Areal
Ca. 805 m2
Pris pr. md.
Ca. 5,600 EUR pr md
Område
Riihimäki, Kanta-Häme
Type
Industrial property
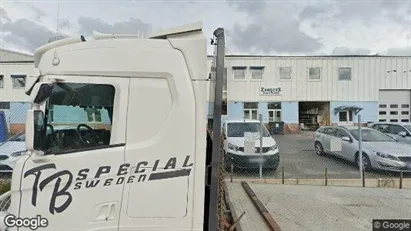
Industrial property in Nacka, Stockholm County
 More info
Industrial property in Nacka, Stockholm County
Industrial property for rent in Nacka, Stockholm County
Areal
-
Pris pr. md.
Ca. 579,150 SEK pr md
Område
Nacka, Stockholm County
Type
Industrial property
Industrial property in Stockholm South, Stockholm
More info
Industrial property in Stockholm South, Stockholm
Industrial property for rent in Stockholm South, Stockholm
Areal
Ca. 30 m2
Pris pr. md.
Ca. 4,500 SEK pr md
Område
Stockholm South, Stockholm
Type
Industrial property
Warehouse in Strängnäs, Södermanland County
More info
Warehouse in Strängnäs, Södermanland County
Warehouse for rent in Strängnäs, Södermanland County
Areal
Ca. 75 m2
Pris pr. md.
Not stated
Område
Strängnäs, Södermanland County
Type
Warehouse
Warehouse in Glostrup, Greater Copenhagen
More info
Warehouse in Glostrup, Greater Copenhagen
Warehouse for rent in Glostrup, Greater Copenhagen
Areal
Ca. 17,230 m2
Pris pr. md.
Ca. 1,368,800 DKK pr md
Område
Glostrup, Greater Copenhagen
Type
Warehouse
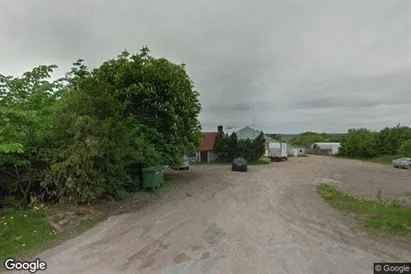
Industrial property in Halmstad, Halland County
 More info
Industrial property in Halmstad, Halland County
Industrial property for rent in Halmstad, Halland County
Areal
400 - 1,000 m2
Pris pr. md.
Not stated
Område
Halmstad, Halland County
Type
Industrial property
Warehouse in Odder, Central Jutland Region
More info
Warehouse in Odder, Central Jutland Region
Warehouse for rent in Odder, Central Jutland Region
Areal
Ca. 325 m2
Pris pr. md.
Ca. 11,400 DKK pr md
Område
Odder, Central Jutland Region
Type
Warehouse
Selected customers
30,000 customers use Companyspace.com
30,000 customers
285,000 companies in our database
2,400 rentals annually
Companyspace.com is used by thousands of landlords, property companies, commercial real estate agents, investors and business centres seeking greater visibility, more enquiries and lower vacancy rates.


