


Industrial properties in Europe
Companyspace.com today:
New today 2,965
Updated 24h 3,039
Notifications about new companyspaces2,189
Copenhagen +6
Stockholm +10
Amsterdam +3
Berlin +3
Vienna +6
Paris +5
Madrid +4
Dublin (county) +23
Warsaw +19
Greater London +14
Latest update 2 h ago
Active ads 369,199
19,091 industrial properties found
Industrial property in Hull - North Humberside, North East
 More info
Industrial property in Hull - North Humberside, North East
Production for rent in Hull - North Humberside, North East
Areal
Ca. 3,265 m2
Pris pr. md.
Ca. 22,000 GBP pr md
Område
Hull - North Humberside, North East
Type
Industrial property
Industrial property in Pirkkala, Pirkanmaa
 More info
Industrial property in Pirkkala, Pirkanmaa
Industrial property for rent in Pirkkala, Pirkanmaa
Areal
Ca. 30 m2
Pris pr. md.
Ca. 500 EUR pr md
Område
Pirkkala, Pirkanmaa
Type
Industrial property
Industrial property in Espoo, Uusimaa
 More info
Industrial property in Espoo, Uusimaa
Industrial property for rent in Espoo, Uusimaa
Areal
Ca. 275 m2
Pris pr. md.
Ca. 1,500 EUR pr md
Område
Espoo, Uusimaa
Type
Industrial property
Warehouse in Odense SØ, Odense
 More info
Warehouse in Odense SØ, Odense
Warehouse for rent in Odense SØ, Odense
Areal
Ca. 280 m2
Pris pr. md.
Ca. 11,450 DKK pr md
Område
Odense SØ, Odense
Type
Warehouse
Industrial property in Helsinki Itäinen, Helsinki
 More info
Industrial property in Helsinki Itäinen, Helsinki
Industrial property for rent in Helsinki Itäinen, Helsinki
Areal
Ca. 55 m2
Pris pr. md.
Ca. 550 EUR pr md
Område
Helsinki Itäinen, Helsinki
Type
Industrial property
Industrial property in Helsinki Itäinen, Helsinki
 More info
Industrial property in Helsinki Itäinen, Helsinki
Industrial property for rent in Helsinki Itäinen, Helsinki
Areal
Ca. 40 m2
Pris pr. md.
Ca. 400 EUR pr md
Område
Helsinki Itäinen, Helsinki
Type
Industrial property
Industrial property in Varberg, Halland County
More info
Industrial property in Varberg, Halland County
Industrial property for rent in Varberg, Halland County
Areal
Ca. 1,020 m2
Pris pr. md.
Ca. 85,150 SEK pr md
Område
Varberg, Halland County
Type
Industrial property
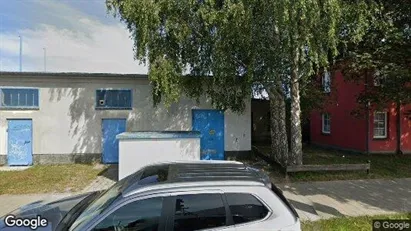
Industrial property in Lahti, Päijät-Häme
 More info
Industrial property in Lahti, Päijät-Häme
Industrial property for rent in Lahti, Päijät-Häme
Areal
Ca. 145 m2
Pris pr. md.
Ca. 1,750 EUR pr md
Område
Lahti, Päijät-Häme
Type
Industrial property
Industrial property in Slagelse, Region Zealand
 More info
Industrial property in Slagelse, Region Zealand
Industrial property for rent in Slagelse, Region Zealand
Areal
Ca. 350 m2
Pris pr. md.
Ca. 15,000 DKK pr md
Område
Slagelse, Region Zealand
Type
Industrial property
Office space in Stad Gent, Gent
 More info
Office space in Stad Gent, Gent
Office space for rent in Stad Gent, Gent
Areal
Ca. 90 m2
Pris pr. md.
Ca. 3,250 EUR pr md
Område
Stad Gent, Gent
Type
Office space
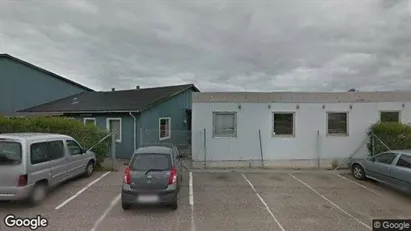
Industrial property in Vojens, Region of Southern Denmark
 More info
Industrial property in Vojens, Region of Southern Denmark
Industrial property for rent in Vojens, Region of Southern Denmark
Areal
Ca. 1,115 m2
Pris pr. md.
Ca. 23,200 DKK pr md
Område
Vojens, Region of Southern Denmark
Type
Industrial property
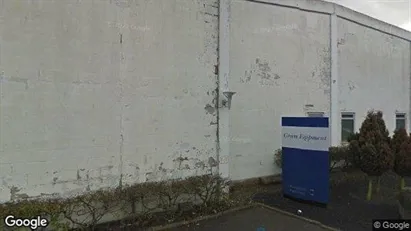
Industrial property in Helsinki Koillinen, Helsinki
 More info
Industrial property in Helsinki Koillinen, Helsinki
Industrial property for rent in Helsinki Koillinen, Helsinki
Areal
Ca. 190 m2
Pris pr. md.
Ca. 1,650 EUR pr md
Område
Helsinki Koillinen, Helsinki
Type
Industrial property
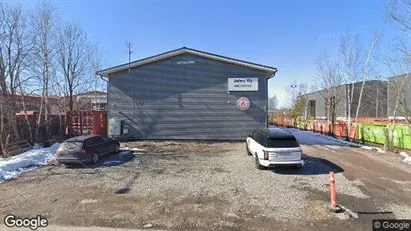
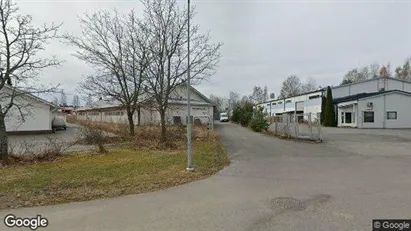
Industrial property in Pori, Satakunta
 More info
Industrial property in Pori, Satakunta
Industrial property for rent in Pori, Satakunta
Areal
Ca. 180 m2
Pris pr. md.
Ca. 1,100 EUR pr md
Område
Pori, Satakunta
Type
Industrial property
Industrial property in Helsinki Koillinen, Helsinki
 More info
Industrial property in Helsinki Koillinen, Helsinki
Industrial property for rent in Helsinki Koillinen, Helsinki
Areal
Ca. 20 m2
Pris pr. md.
Ca. 250 EUR pr md
Område
Helsinki Koillinen, Helsinki
Type
Industrial property
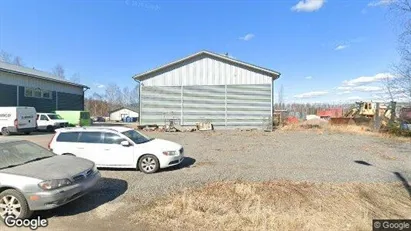
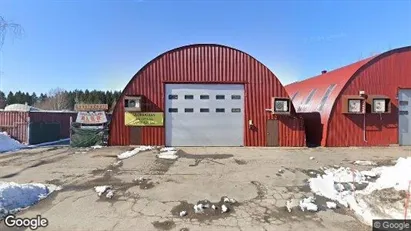
Industrial property in Kempele, Pohjois-Pohjanmaa
 More info
Industrial property in Kempele, Pohjois-Pohjanmaa
Industrial property for rent in Kempele, Pohjois-Pohjanmaa
Areal
Ca. 195 m2
Pris pr. md.
Ca. 1,500 EUR pr md
Område
Kempele, Pohjois-Pohjanmaa
Type
Industrial property
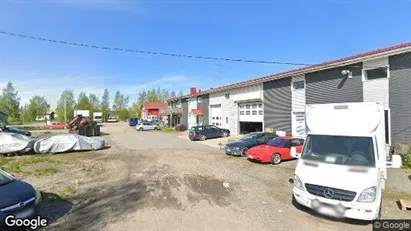
Industrial property in Pori, Satakunta
 More info
Industrial property in Pori, Satakunta
Industrial property for rent in Pori, Satakunta
Areal
Ca. 190 m2
Pris pr. md.
Ca. 900 EUR pr md
Område
Pori, Satakunta
Type
Industrial property
Warehouse in Sønderborg, Region of Southern Denmark
More info
Warehouse in Sønderborg, Region of Southern Denmark
Warehouse for rent in Sønderborg, Region of Southern Denmark
Areal
Ca. 220 m2
Pris pr. md.
Ca. 7,350 DKK pr md
Område
Sønderborg, Region of Southern Denmark
Type
Warehouse
Industrial property in Vorpommern-Rügen, Mecklenburg-Vorpommern
 More info
Industrial property in Vorpommern-Rügen, Mecklenburg-Vorpommern
Industrial property for rent in Vorpommern-Rügen, Mecklenburg-Vorpommern
Areal
Ca. 520 m2
Pris pr. md.
Not stated
Område
Vorpommern-Rügen, Mecklenburg-Vorpommern
Type
Industrial property
Selected customers
30,000 customers use Companyspace.com
30,000 customers
285,000 companies in our database
2,400 rentals annually
Companyspace.com is used by thousands of landlords, property companies, commercial real estate agents, investors and business centres seeking greater visibility, more enquiries and lower vacancy rates.


