


Industrial properties in Europe
Companyspace.com today:
New today 2,911
Updated 24h 3,925
Notifications about new companyspaces2,086
Copenhagen +4
Stockholm +1
Amsterdam +3
Berlin +3
Vienna +6
Paris +5
Madrid +4
Dublin (county) +23
Warsaw +19
Greater London +13
Latest update 24 min ago
Active ads 369,195
19,085 industrial properties found
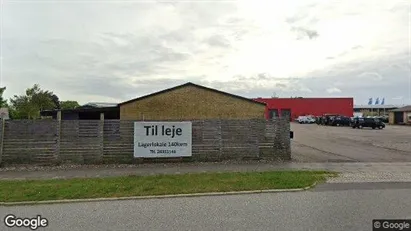
Warehouse in Randers NV, Randers
 More info
Warehouse in Randers NV, Randers
Warehouse for rent in Randers NV, Randers
Areal
Ca. 1,505 m2
Pris pr. md.
Ca. 25,050 DKK pr md
Område
Randers NV, Randers
Type
Warehouse
Industrial property in Roskilde, Greater Copenhagen
 More info
Industrial property in Roskilde, Greater Copenhagen
Industrial property for rent in Roskilde, Greater Copenhagen
Areal
Ca. 350 m2
Pris pr. md.
Ca. 20,750 DKK pr md
Område
Roskilde, Greater Copenhagen
Type
Industrial property
Warehouse in Randers NV, Randers
More info
Warehouse in Randers NV, Randers
Warehouse for rent in Randers NV, Randers
Areal
Ca. 295 m2
Pris pr. md.
Ca. 6,150 DKK pr md
Område
Randers NV, Randers
Type
Warehouse
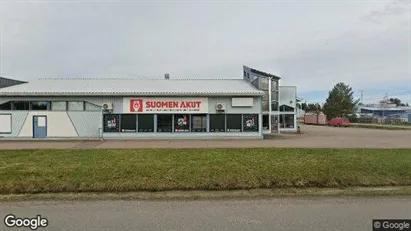
Industrial property in Kouvola, Kymenlaakso
 More info
Industrial property in Kouvola, Kymenlaakso
Industrial property for rent in Kouvola, Kymenlaakso
Areal
Ca. 145 m2
Pris pr. md.
Ca. 850 EUR pr md
Område
Kouvola, Kymenlaakso
Type
Industrial property
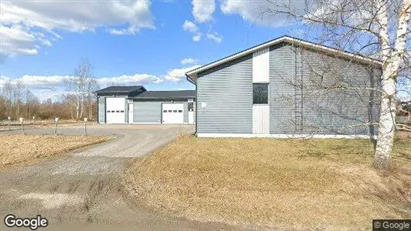
Industrial property in Pori, Satakunta
 More info
Industrial property in Pori, Satakunta
Industrial property for rent in Pori, Satakunta
Areal
Ca. 105 m2
Pris pr. md.
Ca. 700 EUR pr md
Område
Pori, Satakunta
Type
Industrial property
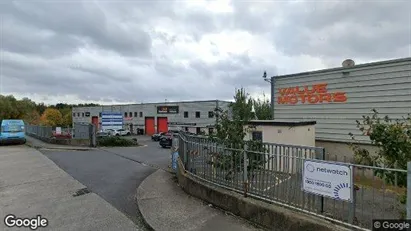
Industrial property in Dublin 11, Dublin
 More info
Industrial property in Dublin 11, Dublin
Industrial property for rent in Dublin 11, Dublin
Areal
Ca. 250 m2
Pris pr. md.
Ca. 3,600 EUR pr md
Område
Dublin 11, Dublin
Type
Industrial property
Industrial property in Kapellen, Antwerp (Province)
 More info
Industrial property in Kapellen, Antwerp (Province)
Industrial property for rent in Kapellen, Antwerp (Province)
Areal
Ca. 280 m2
Pris pr. md.
Ca. 1,800 EUR pr md
Område
Kapellen, Antwerp (Province)
Type
Industrial property
Industrial property in Edam-Volendam, North Holland
 More info
Industrial property in Edam-Volendam, North Holland
Productie te koop in Edam-Volendam, Noord-Holland
Areal
Ca. 230 m2
Pris
Ca. 675,000EUR
Område
Edam-Volendam, North Holland
Type
Industrial property
Industrial property in Lahti, Päijät-Häme
 More info
Industrial property in Lahti, Päijät-Häme
Industrial property for rent in Lahti, Päijät-Häme
Areal
38 - 55 m2
Pris pr. md.
Ca. 300 EUR pr md
Område
Lahti, Päijät-Häme
Type
Industrial property
Industrial property in Helsinki Eteläinen, Helsinki
 More info
Industrial property in Helsinki Eteläinen, Helsinki
Teollisuuskiinteistö Vuokrattavana sisälläHelsinki Eteläinen, Helsinki
Areal
Ca. 110 m2
Pris pr. md.
Ca. 100 EUR pr md
Område
Helsinki Eteläinen, Helsinki
Type
Industrial property
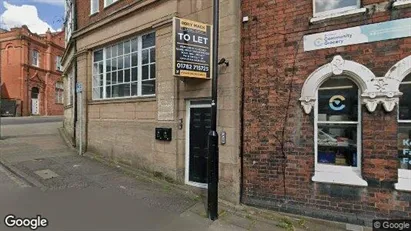
Industrial property in Stoke-on-Trent - Staffordshire, West Midlands
 More info
Industrial property in Stoke-on-Trent - Staffordshire, West Midlands
Production for rent in Stoke-on-Trent - Staffordshire, West Midlands
Areal
-
Pris pr. md.
Ca. 5,750 GBP pr md
Område
Stoke-on-Trent - Staffordshire, West Midlands
Type
Industrial property
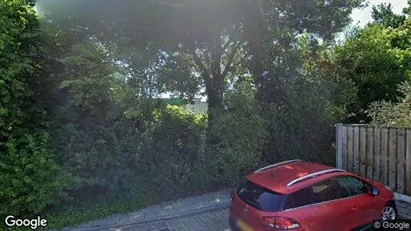
Industrial property in Almelo, Overijssel
 More info
Industrial property in Almelo, Overijssel
Productie te koop in Almelo, Overijssel
Areal
Ca. 900 m2
Pris
Ca. 620,000EUR
Område
Almelo, Overijssel
Type
Industrial property
Warehouse in Regstrup, Region Zealand
More info
Warehouse in Regstrup, Region Zealand
Warehouse for rent in Regstrup, Region Zealand
Areal
Ca. 1,280 m2
Pris pr. md.
Ca. 48,000 DKK pr md
Område
Regstrup, Region Zealand
Type
Warehouse
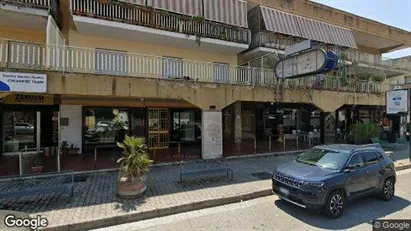
Industrial property in Casagiove, Campania
 More info
Industrial property in Casagiove, Campania
Industrial property for rent in Casagiove, Campania
Areal
Ca. 130 m2
Pris pr. md.
Ca. 1,000 EUR pr md
Område
Casagiove, Campania
Type
Industrial property
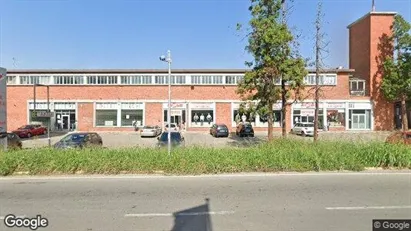
Warehouse in Abbiategrasso, Lombardia
 More info
Warehouse in Abbiategrasso, Lombardia
Warehouse for rent in Abbiategrasso, Lombardia
Areal
Ca. 1,065 m2
Pris pr. md.
Ca. 3,000 EUR pr md
Område
Abbiategrasso, Lombardia
Type
Warehouse
Industrial property in Lomma, Skåne County
More info
Industrial property in Lomma, Skåne County
Industrial property for rent in Lomma, Skåne County
Areal
Ca. 1,055 m2
Pris pr. md.
Ca. 8,000 SEK pr md
Område
Lomma, Skåne County
Type
Industrial property
Warehouse in Viborg, Central Jutland Region
 More info
Warehouse in Viborg, Central Jutland Region
Warehouse for rent in Viborg, Central Jutland Region
Areal
Ca. 105 m2
Pris pr. md.
Ca. 4,500 DKK pr md
Område
Viborg, Central Jutland Region
Type
Warehouse
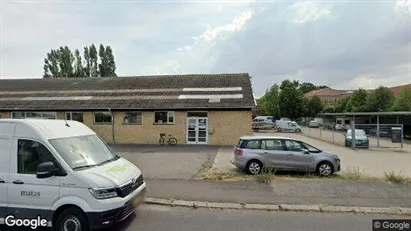
Office space in Glostrup, Greater Copenhagen
 More info
Office space in Glostrup, Greater Copenhagen
Office space for rent in Glostrup, Greater Copenhagen
Areal
Ca. 575 m2
Pris pr. md.
Ca. 43,000 DKK pr md
Område
Glostrup, Greater Copenhagen
Type
Office space
Selected customers
30,000 customers use Companyspace.com
30,000 customers
285,000 companies in our database
2,400 rentals annually
Companyspace.com is used by thousands of landlords, property companies, commercial real estate agents, investors and business centres seeking greater visibility, more enquiries and lower vacancy rates.


