


Industrial properties in Europe
Companyspace.com today:
New today 2,965
Updated 24h 3,123
Notifications about new companyspaces2,183
Copenhagen +6
Stockholm +10
Amsterdam +3
Berlin +3
Vienna +6
Paris +5
Madrid +4
Dublin (county) +23
Warsaw +19
Greater London +14
Latest update 1 h ago
Active ads 369,199
19,091 industrial properties found
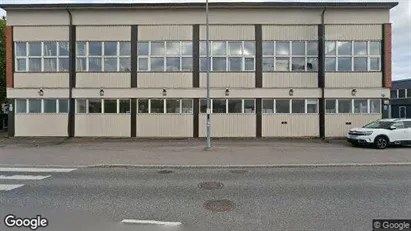
Industrial property in Helsinki Kaakkoinen, Helsinki
 More info
Industrial property in Helsinki Kaakkoinen, Helsinki
Industrial property for rent in Helsinki Kaakkoinen, Helsinki
Areal
Ca. 250 m2
Pris pr. md.
Ca. 3,000 EUR pr md
Område
Helsinki Kaakkoinen, Helsinki
Type
Industrial property
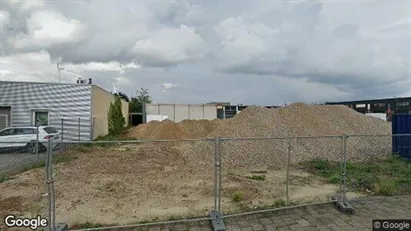
Industrial property in Den Bosch, North Brabant
 More info
Industrial property in Den Bosch, North Brabant
Industrial property for rent in Den Bosch, North Brabant
Areal
Ca. 200 m2
Pris pr. md.
Ca. 2,000 EUR pr md
Område
Den Bosch, North Brabant
Type
Industrial property
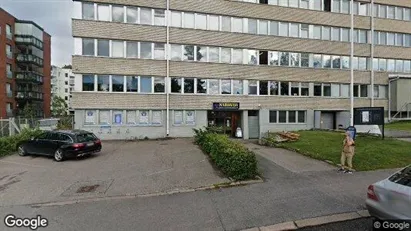
Industrial property in Helsinki Eteläinen, Helsinki
 More info
Industrial property in Helsinki Eteläinen, Helsinki
Industrial property for rent in Helsinki Eteläinen, Helsinki
Areal
Ca. 95 m2
Pris pr. md.
Ca. 850 EUR pr md
Område
Helsinki Eteläinen, Helsinki
Type
Industrial property
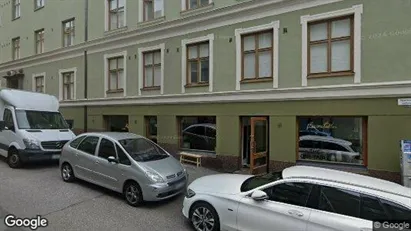
Industrial property in Helsinki Eteläinen, Helsinki
 More info
Industrial property in Helsinki Eteläinen, Helsinki
Industrial property for rent in Helsinki Eteläinen, Helsinki
Areal
Ca. 85 m2
Pris pr. md.
Ca. 1,000 EUR pr md
Område
Helsinki Eteläinen, Helsinki
Type
Industrial property
Industrial property in Vantaa, Uusimaa
 More info
Industrial property in Vantaa, Uusimaa
Industrial property for rent in Vantaa, Uusimaa
Areal
100 - 1,000 m2
Pris pr. md.
Ca. 2,000 EUR pr md
Område
Vantaa, Uusimaa
Type
Industrial property
Industrial property in Lohja, Uusimaa
 More info
Industrial property in Lohja, Uusimaa
Industrial property for rent in Lohja, Uusimaa
Areal
Ca. 70 m2
Pris pr. md.
Ca. 750 EUR pr md
Område
Lohja, Uusimaa
Type
Industrial property
Warehouse in Copenhagen SV, Copenhagen
 More info
Warehouse in Copenhagen SV, Copenhagen
Warehouse for rent in Copenhagen SV, Copenhagen
Areal
Ca. 400 m2
Pris pr. md.
Ca. 37,600 DKK pr md
Område
Copenhagen SV, Copenhagen
Type
Warehouse
Industrial property in Paterna, Comunidad Valenciana
 More info
Industrial property in Paterna, Comunidad Valenciana
Industrial property for rent in Paterna, Comunidad Valenciana
Areal
-
Pris pr. md.
Ca. 2,600 EUR pr md
Område
Paterna, Comunidad Valenciana
Type
Industrial property
Industrial property in Vorpommern-Rügen, Mecklenburg-Vorpommern
 More info
Industrial property in Vorpommern-Rügen, Mecklenburg-Vorpommern
Industrial property for rent in Vorpommern-Rügen, Mecklenburg-Vorpommern
Areal
Ca. 3,000 m2
Pris pr. md.
Not stated
Område
Vorpommern-Rügen, Mecklenburg-Vorpommern
Type
Industrial property
Industrial property in Noordoostpolder, Flevoland
 More info
Industrial property in Noordoostpolder, Flevoland
Industrial property for rent in Noordoostpolder, Flevoland
Areal
Ca. 75 m2
Pris pr. md.
Ca. 1,100 EUR pr md
Område
Noordoostpolder, Flevoland
Type
Industrial property
Industrial property in Hoogeveen, Drenthe
 More info
Industrial property in Hoogeveen, Drenthe
Industrial property for rent in Hoogeveen, Drenthe
Areal
-
Pris pr. md.
Ca. 800 EUR pr md
Område
Hoogeveen, Drenthe
Type
Industrial property
Industrial property in Hoogeveen, Drenthe
 More info
Industrial property in Hoogeveen, Drenthe
Industrial property for rent in Hoogeveen, Drenthe
Areal
-
Pris pr. md.
Ca. 50 EUR pr md
Område
Hoogeveen, Drenthe
Type
Industrial property
Warehouse in Copenhagen S, Copenhagen
 More info
Warehouse in Copenhagen S, Copenhagen
Warehouse for rent in Copenhagen S, Copenhagen
Areal
Ca. 155 m2
Pris pr. md.
Ca. 9,700 DKK pr md
Område
Copenhagen S, Copenhagen
Type
Warehouse
Warehouse in Elbe-Elster, Brandenburg
 More info
Warehouse in Elbe-Elster, Brandenburg
Warehouse for rent in Elbe-Elster, Brandenburg
Areal
Ca. 50 m2
Pris pr. md.
Ca. 2,995,000 EUR pr md
Område
Elbe-Elster, Brandenburg
Type
Warehouse
Industrial property in Halle (Saale), Sachsen-Anhalt
 More info
Industrial property in Halle (Saale), Sachsen-Anhalt
Industrial property for rent in Halle (Saale), Sachsen-Anhalt
Areal
Ca. 50 m2
Pris pr. md.
Ca. 590,000 EUR pr md
Område
Halle (Saale), Sachsen-Anhalt
Type
Industrial property
Industrial property in Hoogeveen, Drenthe
 More info
Industrial property in Hoogeveen, Drenthe
Industrial property for rent in Hoogeveen, Drenthe
Areal
-
Pris pr. md.
Ca. 850 EUR pr md
Område
Hoogeveen, Drenthe
Type
Industrial property
Industrial property in Ciempozuelos, Comunidad de Madrid
 More info
Industrial property in Ciempozuelos, Comunidad de Madrid
Industrial property for rent in Ciempozuelos, Comunidad de Madrid
Areal
-
Pris pr. md.
Ca. 1,800 EUR pr md
Område
Ciempozuelos, Comunidad de Madrid
Type
Industrial property
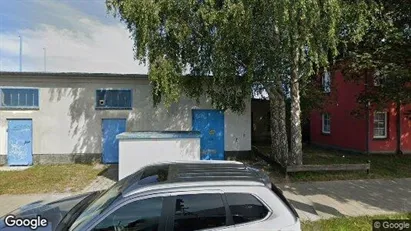
Industrial property in Slagelse, Region Zealand
 More info
Industrial property in Slagelse, Region Zealand
Industrial property for rent in Slagelse, Region Zealand
Areal
Ca. 425 m2
Pris pr. md.
Ca. 15,000 DKK pr md
Område
Slagelse, Region Zealand
Type
Industrial property
Selected customers
30,000 customers use Companyspace.com
30,000 customers
285,000 companies in our database
2,400 rentals annually
Companyspace.com is used by thousands of landlords, property companies, commercial real estate agents, investors and business centres seeking greater visibility, more enquiries and lower vacancy rates.


