


Industrial properties in Europe
Companyspace.com today:
New today 2,911
Updated 24h 3,925
Notifications about new companyspaces2,086
Copenhagen +4
Stockholm +1
Amsterdam +3
Berlin +3
Vienna +6
Paris +5
Madrid +4
Dublin (county) +23
Warsaw +19
Greater London +13
Latest update 23 min ago
Active ads 369,195
19,085 industrial properties found
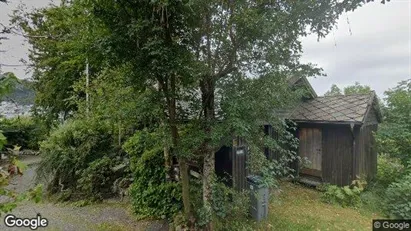
Industrial property in Deatnu Tana, Finnmark
 More info
Industrial property in Deatnu Tana, Finnmark
Industrial property for sale in Deatnu Tana, Finnmark
Areal
Ca. 685 m2
Pris
Ca. 1,377,000EUR
Område
Deatnu Tana, Finnmark
Type
Industrial property
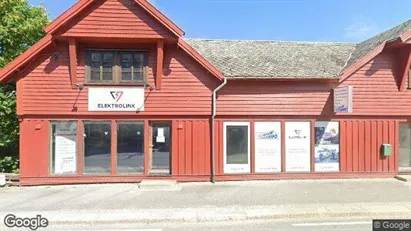
Industrial property in Gloppen, Sogn og Fjordane
 More info
Industrial property in Gloppen, Sogn og Fjordane
Industrial property for sale in Gloppen, Sogn og Fjordane
Areal
Ca. 445 m2
Pris
Ca. 487,000EUR
Område
Gloppen, Sogn og Fjordane
Type
Industrial property
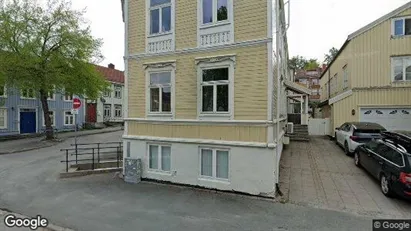
Industrial property in Bamble, Telemark
 More info
Industrial property in Bamble, Telemark
Industrial property for sale in Bamble, Telemark
Areal
Ca. 190 m2
Pris
Ca. 467,000EUR
Område
Bamble, Telemark
Type
Industrial property
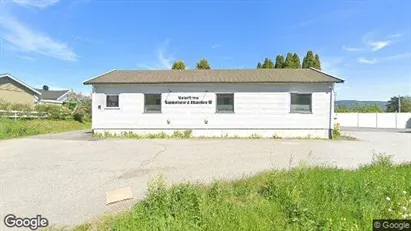
Industrial property in Harstad, Troms
 More info
Industrial property in Harstad, Troms
Industrial property for sale in Harstad, Troms
Areal
Ca. 240 m2
Pris
Ca. 334,000EUR
Område
Harstad, Troms
Type
Industrial property
Industrial property in Eidsvoll, Akershus
 More info
Industrial property in Eidsvoll, Akershus
Industrial property for sale in Eidsvoll, Akershus
Areal
Ca. 1,165 m2
Pris
Ca. 2,950,000EUR
Område
Eidsvoll, Akershus
Type
Industrial property
Industrial property in Bergen Årstad, Bergen (region)
 More info
Industrial property in Bergen Årstad, Bergen (region)
Industrial property for sale in Bergen Årstad, Bergen (region)
Areal
Ca. 130 m2
Pris
Ca. 688,000EUR
Område
Bergen Årstad, Bergen (region)
Type
Industrial property
Industrial property in Bergen Bergenhus, Bergen (region)
 More info
Industrial property in Bergen Bergenhus, Bergen (region)
Industrial property for sale in Bergen Bergenhus, Bergen (region)
Areal
Ca. 90 m2
Pris
Ca. 393,000EUR
Område
Bergen Bergenhus, Bergen (region)
Type
Industrial property
Industrial property in Karmøy, Rogaland
 More info
Industrial property in Karmøy, Rogaland
Industrial property for sale in Karmøy, Rogaland
Areal
Ca. 1,360 m2
Pris
Ca. 787,000EUR
Område
Karmøy, Rogaland
Type
Industrial property
Industrial property in Trondheim Østbyen, Trondheim
 More info
Industrial property in Trondheim Østbyen, Trondheim
Industrial property for sale in Trondheim Østbyen, Trondheim
Areal
Ca. 90 m2
Pris
Ca. 196,000EUR
Område
Trondheim Østbyen, Trondheim
Type
Industrial property
Industrial property in Ringerike, Buskerud
 More info
Industrial property in Ringerike, Buskerud
Industrial property for sale in Ringerike, Buskerud
Areal
Ca. 270 m2
Pris
Ca. 343,000EUR
Område
Ringerike, Buskerud
Type
Industrial property
Industrial property in Kerava, Uusimaa
 More info
Industrial property in Kerava, Uusimaa
Industrial property for rent in Kerava, Uusimaa
Areal
Ca. 120 m2
Pris pr. md.
Ca. 850 EUR pr md
Område
Kerava, Uusimaa
Type
Industrial property
Industrial property in Harstad, Troms
 More info
Industrial property in Harstad, Troms
Industrial property for sale in Harstad, Troms
Areal
Ca. 925 m2
Pris
Ca. 1,308,000EUR
Område
Harstad, Troms
Type
Industrial property
Industrial property in Sør-Varanger, Finnmark
 More info
Industrial property in Sør-Varanger, Finnmark
Industrial property for sale in Sør-Varanger, Finnmark
Areal
Ca. 2,135 m2
Pris
Ca. 2,950,000EUR
Område
Sør-Varanger, Finnmark
Type
Industrial property
Industrial property in Rygge, Østfold
 More info
Industrial property in Rygge, Østfold
Industrial property for sale in Rygge, Østfold
Areal
Ca. 1,390 m2
Pris
Ca. 2,458,000EUR
Område
Rygge, Østfold
Type
Industrial property
Industrial property in Nannestad, Akershus
 More info
Industrial property in Nannestad, Akershus
Industrial property for sale in Nannestad, Akershus
Areal
Ca. 490 m2
Pris
Ca. 787,000EUR
Område
Nannestad, Akershus
Type
Industrial property
Industrial property in Bærum, Akershus
 More info
Industrial property in Bærum, Akershus
Industrial property for sale in Bærum, Akershus
Areal
Ca. 585 m2
Pris
Ca. 1,377,000EUR
Område
Bærum, Akershus
Type
Industrial property
Industrial property in Grong, Trøndelag
 More info
Industrial property in Grong, Trøndelag
Industrial property for sale in Grong, Trøndelag
Areal
Ca. 1,795 m2
Pris
Ca. 590,000EUR
Område
Grong, Trøndelag
Type
Industrial property
Industrial property in Voss, Hordaland
 More info
Industrial property in Voss, Hordaland
Industrial property for sale in Voss, Hordaland
Areal
Ca. 70 m2
Pris
Ca. 137,000EUR
Område
Voss, Hordaland
Type
Industrial property
Selected customers
30,000 customers use Companyspace.com
30,000 customers
285,000 companies in our database
2,400 rentals annually
Companyspace.com is used by thousands of landlords, property companies, commercial real estate agents, investors and business centres seeking greater visibility, more enquiries and lower vacancy rates.


