


Industrial properties in Europe
Companyspace.com today:
New today 2,911
Updated 24h 3,925
Notifications about new companyspaces2,086
Copenhagen +4
Stockholm +1
Amsterdam +3
Berlin +3
Vienna +6
Paris +5
Madrid +4
Dublin (county) +23
Warsaw +19
Greater London +13
Latest update 23 min ago
Active ads 369,195
19,085 industrial properties found
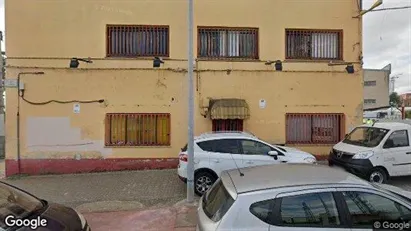
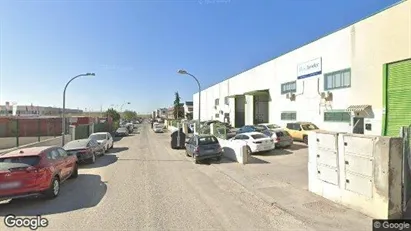
Industrial property in Málaga, Andalucía
 More info
Industrial property in Málaga, Andalucía
Industrial property for sale in Málaga, Andalucía
Areal
-
Pris
Ca. 1,499,000EUR
Område
Málaga, Andalucía
Type
Industrial property
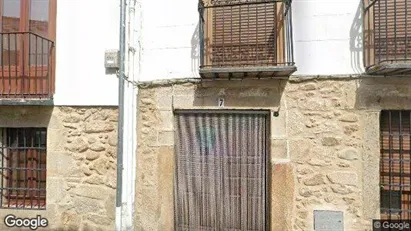
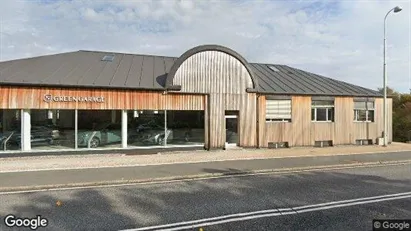
Industrial property in Aldeanueva del Camino, Extremadura
 More info
Industrial property in Aldeanueva del Camino, Extremadura
Industrial property for sale in Aldeanueva del Camino, Extremadura
Areal
-
Pris
Ca. 497,000EUR
Område
Aldeanueva del Camino, Extremadura
Type
Industrial property
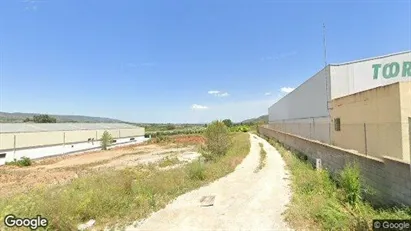
Industrial property in Pinto, Comunidad de Madrid
 More info
Industrial property in Pinto, Comunidad de Madrid
Industrial property for rent in Pinto, Comunidad de Madrid
Areal
-
Pris pr. md.
Ca. 7,900 EUR pr md
Område
Pinto, Comunidad de Madrid
Type
Industrial property
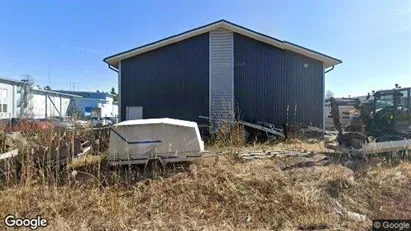
Industrial property in Pori, Satakunta
 More info
Industrial property in Pori, Satakunta
Industrial property for rent in Pori, Satakunta
Areal
Ca. 110 m2
Pris pr. md.
Ca. 700 EUR pr md
Område
Pori, Satakunta
Type
Industrial property
Industrial property in Vallada, Comunidad Valenciana
 More info
Industrial property in Vallada, Comunidad Valenciana
Industrial property for sale in Vallada, Comunidad Valenciana
Areal
-
Pris
Ca. 265,000EUR
Område
Vallada, Comunidad Valenciana
Type
Industrial property
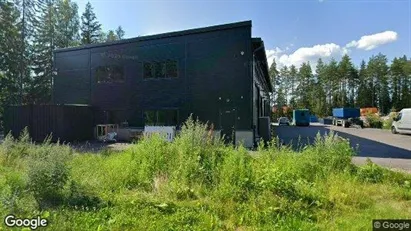
Industrial property in Kirkkonummi, Uusimaa
 More info
Industrial property in Kirkkonummi, Uusimaa
Industrial property for rent in Kirkkonummi, Uusimaa
Areal
Ca. 55 m2
Pris pr. md.
Ca. 600 EUR pr md
Område
Kirkkonummi, Uusimaa
Type
Industrial property
Industrial property in Colmenar Viejo, Comunidad de Madrid
 More info
Industrial property in Colmenar Viejo, Comunidad de Madrid
Industrial property for sale in Colmenar Viejo, Comunidad de Madrid
Areal
-
Pris
Ca. 3,990,000EUR
Område
Colmenar Viejo, Comunidad de Madrid
Type
Industrial property
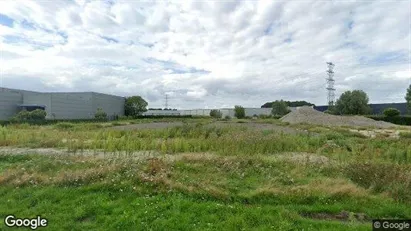
Industrial property in Enschede, Overijssel
 More info
Industrial property in Enschede, Overijssel
Productie te koop in Enschede, Overijssel
Areal
Ca. 160 m2
Pris
Ca. 275,000EUR
Område
Enschede, Overijssel
Type
Industrial property
Warehouse in Vejle, Vejle (region)
 More info
Warehouse in Vejle, Vejle (region)
Warehouse for rent in Vejle, Vejle (region)
Areal
Ca. 40 m2
Pris pr. md.
Ca. 3,500 DKK pr md
Område
Vejle, Vejle (region)
Type
Warehouse
Warehouse in Birkerød, North Zealand
 More info
Warehouse in Birkerød, North Zealand
Warehouse for rent in Birkerød, North Zealand
Areal
Ca. 30 m2
Pris pr. md.
Ca. 5,800 DKK pr md
Område
Birkerød, North Zealand
Type
Warehouse
Industrial property in Hoogeveen, Drenthe
 More info
Industrial property in Hoogeveen, Drenthe
Industrial property for rent in Hoogeveen, Drenthe
Areal
-
Pris pr. md.
Ca. 1,750 EUR pr md
Område
Hoogeveen, Drenthe
Type
Industrial property
Warehouse in Odense SØ, Odense
More info
Warehouse in Odense SØ, Odense
Warehouse for rent in Odense SØ, Odense
Areal
Ca. 230 m2
Pris pr. md.
Ca. 9,450 DKK pr md
Område
Odense SØ, Odense
Type
Warehouse
Industrial property in Raisio, Varsinais-Suomi
 More info
Industrial property in Raisio, Varsinais-Suomi
Industrial property for rent in Raisio, Varsinais-Suomi
Areal
Ca. 40 m2
Pris pr. md.
Ca. 650 EUR pr md
Område
Raisio, Varsinais-Suomi
Type
Industrial property
Industrial property in Jyväskylä, Keski-Suomi
 More info
Industrial property in Jyväskylä, Keski-Suomi
Industrial property for rent in Jyväskylä, Keski-Suomi
Areal
Ca. 20 m2
Pris pr. md.
Ca. 250 EUR pr md
Område
Jyväskylä, Keski-Suomi
Type
Industrial property
Warehouse in Albertslund, Greater Copenhagen
More info
Warehouse in Albertslund, Greater Copenhagen
Warehouse for rent in Albertslund, Greater Copenhagen
Areal
Ca. 150 m2
Pris pr. md.
Ca. 20,000 DKK pr md
Område
Albertslund, Greater Copenhagen
Type
Warehouse
Industrial property in Helsinki Keskinen, Helsinki
 More info
Industrial property in Helsinki Keskinen, Helsinki
Industrial property for rent in Helsinki Keskinen, Helsinki
Areal
Ca. 80 m2
Pris pr. md.
Ca. 600 EUR pr md
Område
Helsinki Keskinen, Helsinki
Type
Industrial property
Industrial property in Den Bosch, North Brabant
 More info
Industrial property in Den Bosch, North Brabant
Industrial property for rent in Den Bosch, North Brabant
Areal
Ca. 1,080 m2
Pris pr. md.
Ca. 8,750 EUR pr md
Område
Den Bosch, North Brabant
Type
Industrial property
Industrial property in Helsinki Koillinen, Helsinki
 More info
Industrial property in Helsinki Koillinen, Helsinki
Industrial property for rent in Helsinki Koillinen, Helsinki
Areal
Ca. 130 m2
Pris pr. md.
Ca. 1,350 EUR pr md
Område
Helsinki Koillinen, Helsinki
Type
Industrial property
Selected customers
30,000 customers use Companyspace.com
30,000 customers
285,000 companies in our database
2,400 rentals annually
Companyspace.com is used by thousands of landlords, property companies, commercial real estate agents, investors and business centres seeking greater visibility, more enquiries and lower vacancy rates.


