


Industrial properties in Europe
Companyspace.com today:
New today 2,899
Updated 24h 3,921
Notifications about new companyspaces1,937
Copenhagen +2
Stockholm +1
Amsterdam +3
Berlin +3
Vienna +6
Paris +5
Madrid +4
Dublin (county) +23
Warsaw +19
Greater London +13
Latest update 1 h ago
Active ads 369,114
19,081 industrial properties found
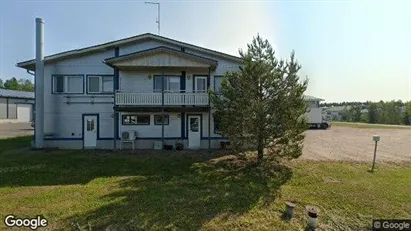
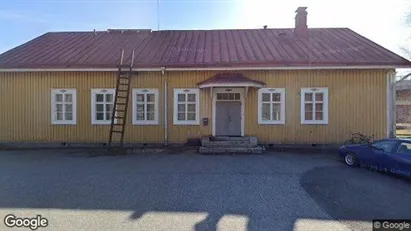
Industrial property in Hämeenlinna, Kanta-Häme
 More info
Industrial property in Hämeenlinna, Kanta-Häme
Industrial property for rent in Hämeenlinna, Kanta-Häme
Areal
Ca. 850 m2
Pris pr. md.
Ca. 6,400 EUR pr md
Område
Hämeenlinna, Kanta-Häme
Type
Industrial property
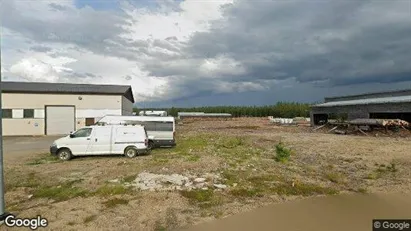
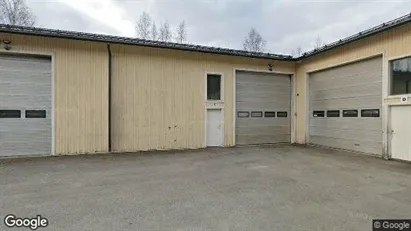
Industrial property in Orimattila, Päijät-Häme
 More info
Industrial property in Orimattila, Päijät-Häme
Industrial property for rent in Orimattila, Päijät-Häme
Areal
-
Pris pr. md.
Ca. 4,000 EUR pr md
Område
Orimattila, Päijät-Häme
Type
Industrial property
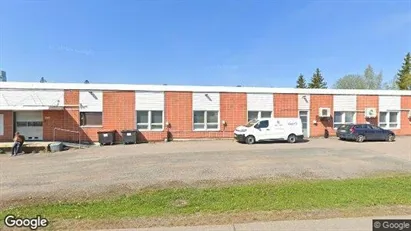
Industrial property in Kangasala, Pirkanmaa
 More info
Industrial property in Kangasala, Pirkanmaa
Teollisuuskiinteistö Vuokrattavana sisälläKangasala, Pirkanmaa
Areal
Ca. 250 m2
Pris pr. md.
Ca. 270,000 EUR pr md
Område
Kangasala, Pirkanmaa
Type
Industrial property
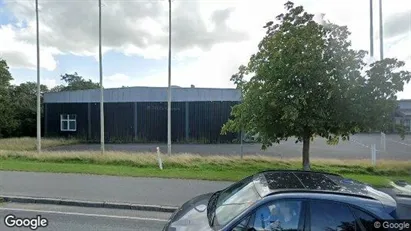
Industrial property in Inari, Lappi
 More info
Industrial property in Inari, Lappi
Industrial property for rent in Inari, Lappi
Areal
Ca. 60 m2
Pris pr. md.
Ca. 800 EUR pr md
Område
Inari, Lappi
Type
Industrial property
Warehouse in Holbæk, Region Zealand
 More info
Warehouse in Holbæk, Region Zealand
Warehouse for rent in Holbæk, Region Zealand
Areal
400 - 2,166 m2
Pris pr. md.
Ca. 22,550 DKK pr md
Område
Holbæk, Region Zealand
Type
Warehouse
Industrial property in Järvenpää, Uusimaa
 More info
Industrial property in Järvenpää, Uusimaa
Industrial property for rent in Järvenpää, Uusimaa
Areal
Ca. 410 m2
Pris pr. md.
Ca. 3,950 EUR pr md
Område
Järvenpää, Uusimaa
Type
Industrial property
Warehouse in Tønder, Region of Southern Denmark
 More info
Warehouse in Tønder, Region of Southern Denmark
Warehouse for rent in Tønder, Region of Southern Denmark
Areal
Ca. 1,315 m2
Pris pr. md.
Ca. 45,900 DKK pr md
Område
Tønder, Region of Southern Denmark
Type
Warehouse
Industrial property in Uusikaupunki, Varsinais-Suomi
 More info
Industrial property in Uusikaupunki, Varsinais-Suomi
Industrial property for rent in Uusikaupunki, Varsinais-Suomi
Areal
Ca. 220 m2
Pris pr. md.
Ca. 600 EUR pr md
Område
Uusikaupunki, Varsinais-Suomi
Type
Industrial property
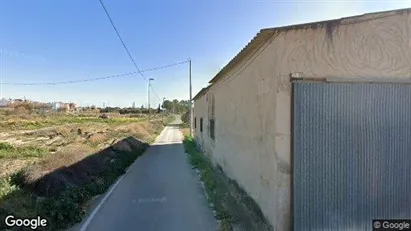
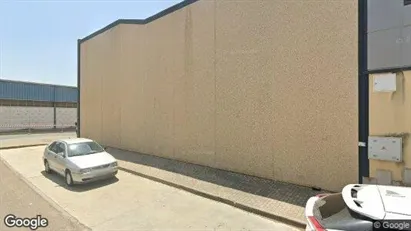
Industrial property in Murcia, Región de Murcia
 More info
Industrial property in Murcia, Región de Murcia
Industrial property for sale in Murcia, Región de Murcia
Areal
-
Pris
Ca. 150,000EUR
Område
Murcia, Región de Murcia
Type
Industrial property
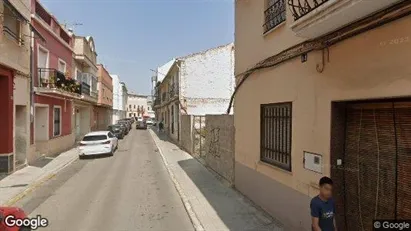
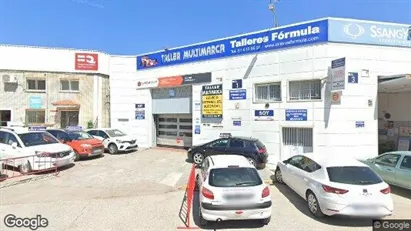
Industrial property in Carcaixent, Comunidad Valenciana
 More info
Industrial property in Carcaixent, Comunidad Valenciana
Industrial property for sale in Carcaixent, Comunidad Valenciana
Areal
-
Pris
Ca. 240,000EUR
Område
Carcaixent, Comunidad Valenciana
Type
Industrial property
Industrial property in Oulu, Pohjois-Pohjanmaa
 More info
Industrial property in Oulu, Pohjois-Pohjanmaa
Industrial property for rent in Oulu, Pohjois-Pohjanmaa
Areal
Ca. 170 m2
Pris pr. md.
Ca. 1,450 EUR pr md
Område
Oulu, Pohjois-Pohjanmaa
Type
Industrial property
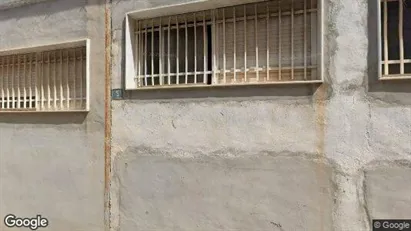
Industrial property in Meco, Comunidad de Madrid
 More info
Industrial property in Meco, Comunidad de Madrid
Industrial property for sale in Meco, Comunidad de Madrid
Areal
-
Pris
Ca. 236,000EUR
Område
Meco, Comunidad de Madrid
Type
Industrial property
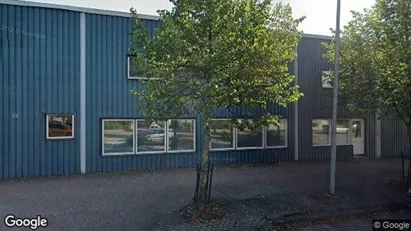
Industrial property in Aia, País Vasco
 More info
Industrial property in Aia, País Vasco
Industrial property for sale in Aia, País Vasco
Areal
-
Pris
Ca. 598,000EUR
Område
Aia, País Vasco
Type
Industrial property
Industrial property in Dos Hermanas, Andalucía
 More info
Industrial property in Dos Hermanas, Andalucía
Industrial property for sale in Dos Hermanas, Andalucía
Areal
-
Pris
Ca. 160,000EUR
Område
Dos Hermanas, Andalucía
Type
Industrial property
Industrial property in Fuenlabrada, Comunidad de Madrid
 More info
Industrial property in Fuenlabrada, Comunidad de Madrid
Industrial property for rent in Fuenlabrada, Comunidad de Madrid
Areal
-
Pris pr. md.
Ca. 8,500 EUR pr md
Område
Fuenlabrada, Comunidad de Madrid
Type
Industrial property
Industrial property in Kalajoki, Pohjois-Pohjanmaa
 More info
Industrial property in Kalajoki, Pohjois-Pohjanmaa
Industrial property for rent in Kalajoki, Pohjois-Pohjanmaa
Areal
Ca. 100 m2
Pris pr. md.
Ca. 1,250 EUR pr md
Område
Kalajoki, Pohjois-Pohjanmaa
Type
Industrial property
Industrial property in Rojales, Comunidad Valenciana
 More info
Industrial property in Rojales, Comunidad Valenciana
Industrial property for sale in Rojales, Comunidad Valenciana
Areal
-
Pris
Ca. 265,000EUR
Område
Rojales, Comunidad Valenciana
Type
Industrial property
Industrial property in Kerava, Uusimaa
 More info
Industrial property in Kerava, Uusimaa
Industrial property for rent in Kerava, Uusimaa
Areal
Ca. 455 m2
Pris pr. md.
Ca. 2,350 EUR pr md
Område
Kerava, Uusimaa
Type
Industrial property
Selected customers
30,000 customers use Companyspace.com
30,000 customers
285,000 companies in our database
2,400 rentals annually
Companyspace.com is used by thousands of landlords, property companies, commercial real estate agents, investors and business centres seeking greater visibility, more enquiries and lower vacancy rates.


