


Industrial properties in Europe
Companyspace.com today:
New today 2,911
Updated 24h 3,925
Notifications about new companyspaces2,086
Copenhagen +4
Stockholm +1
Amsterdam +3
Berlin +3
Vienna +6
Paris +5
Madrid +4
Dublin (county) +23
Warsaw +19
Greater London +13
Latest update 23 min ago
Active ads 369,195
19,085 industrial properties found
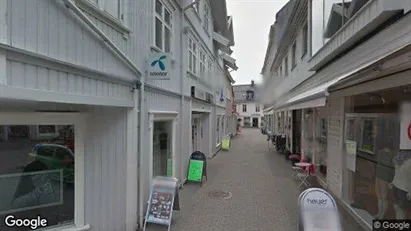
Industrial property in Kragerø, Telemark
 More info
Industrial property in Kragerø, Telemark
Industrial property for sale in Kragerø, Telemark
Areal
Ca. 1,930 m2
Pris
Ca. 1,967,000EUR
Område
Kragerø, Telemark
Type
Industrial property
Industrial property in Etne, Hordaland
 More info
Industrial property in Etne, Hordaland
Industrial property for sale in Etne, Hordaland
Areal
-
Pris
Ca. 1,082,000EUR
Område
Etne, Hordaland
Type
Industrial property
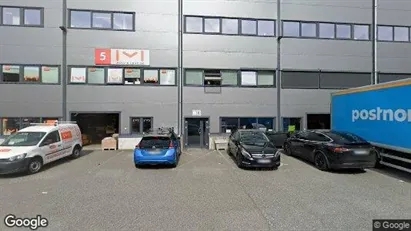
Industrial property in Bergen Fana, Bergen (region)
 More info
Industrial property in Bergen Fana, Bergen (region)
Industrial property for sale in Bergen Fana, Bergen (region)
Areal
Ca. 1,750 m2
Pris
Ca. 2,458,000EUR
Område
Bergen Fana, Bergen (region)
Type
Industrial property
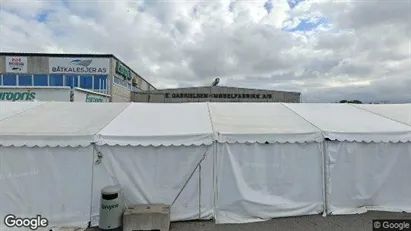
Industrial property in Randaberg, Rogaland
 More info
Industrial property in Randaberg, Rogaland
Industrial property for sale in Randaberg, Rogaland
Areal
Ca. 3,025 m2
Pris
Ca. 3,736,000EUR
Område
Randaberg, Rogaland
Type
Industrial property
Industrial property in Drammen, Buskerud
 More info
Industrial property in Drammen, Buskerud
Industrial property for sale in Drammen, Buskerud
Areal
Ca. 50 m2
Pris
Ca. 196,000EUR
Område
Drammen, Buskerud
Type
Industrial property
Industrial property in Harstad, Troms
 More info
Industrial property in Harstad, Troms
Industrial property for sale in Harstad, Troms
Areal
Ca. 1,940 m2
Pris
Ca. 2,065,000EUR
Område
Harstad, Troms
Type
Industrial property
Industrial property in Ringsaker, Hedmark
 More info
Industrial property in Ringsaker, Hedmark
Industrial property for sale in Ringsaker, Hedmark
Areal
Ca. 1,160 m2
Pris
Ca. 973,000EUR
Område
Ringsaker, Hedmark
Type
Industrial property
Industrial property in Tuusula, Uusimaa
 More info
Industrial property in Tuusula, Uusimaa
Industrial property for rent in Tuusula, Uusimaa
Areal
Ca. 55 m2
Pris pr. md.
Ca. 600 EUR pr md
Område
Tuusula, Uusimaa
Type
Industrial property
Industrial property in Søgne, Vest-Agder
 More info
Industrial property in Søgne, Vest-Agder
Industrial property for sale in Søgne, Vest-Agder
Areal
Ca. 225 m2
Pris
Ca. 295,000EUR
Område
Søgne, Vest-Agder
Type
Industrial property
Warehouse in Kastrup, Copenhagen
 More info
Warehouse in Kastrup, Copenhagen
Warehouse for rent in Kastrup, Copenhagen
Areal
Ca. 120 m2
Pris pr. md.
Ca. 13,000 DKK pr md
Område
Kastrup, Copenhagen
Type
Warehouse
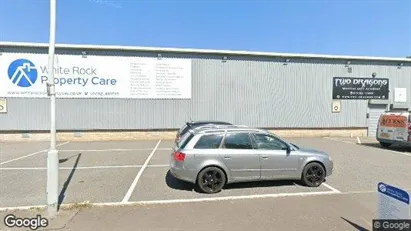
Industrial property in Bridgend - Mid Glamorgan, Cardiff (Region)
 More info
Industrial property in Bridgend - Mid Glamorgan, Cardiff (Region)
Production for rent in Bridgend - Mid Glamorgan, Cardiff (Region)
Areal
-
Pris pr. md.
Ca. 650 GBP pr md
Område
Bridgend - Mid Glamorgan, Cardiff (Region)
Type
Industrial property
Industrial property in Swansea - West Glamorgan, Swansea (Region)
 More info
Industrial property in Swansea - West Glamorgan, Swansea (Region)
Production for rent in Swansea - West Glamorgan, Swansea (Region)
Areal
-
Pris pr. md.
Ca. 1,250 GBP pr md
Område
Swansea - West Glamorgan, Swansea (Region)
Type
Industrial property
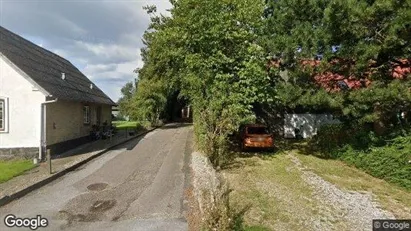
Industrial property in Nordborg, Region of Southern Denmark
 More info
Industrial property in Nordborg, Region of Southern Denmark
Industrial property for rent in Nordborg, Region of Southern Denmark
Areal
Ca. 370 m2
Pris pr. md.
Ca. 6,150 DKK pr md
Område
Nordborg, Region of Southern Denmark
Type
Industrial property
Industrial property in Horsens, Central Jutland Region
 More info
Industrial property in Horsens, Central Jutland Region
Industrial property for rent in Horsens, Central Jutland Region
Areal
Ca. 470 m2
Pris pr. md.
Ca. 35,350 DKK pr md
Område
Horsens, Central Jutland Region
Type
Industrial property
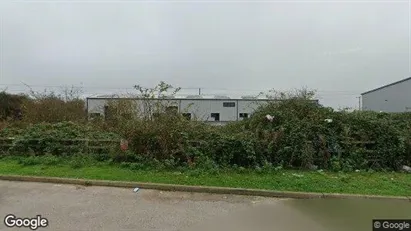
Industrial property in King's Lynn - Norfolk, Peterborough (Region)
 More info
Industrial property in King's Lynn - Norfolk, Peterborough (Region)
Production for sale in King's Lynn - Norfolk, Peterborough (Region)
Areal
Ca. 250 m2
Pris
Ca. 224,000EUR
Område
King's Lynn - Norfolk, Peterborough (Region)
Type
Industrial property
Industrial property in Kuopio, Pohjois-Savo
 More info
Industrial property in Kuopio, Pohjois-Savo
Industrial property for rent in Kuopio, Pohjois-Savo
Areal
Ca. 820 m2
Pris pr. md.
Ca. 6,000 EUR pr md
Område
Kuopio, Pohjois-Savo
Type
Industrial property
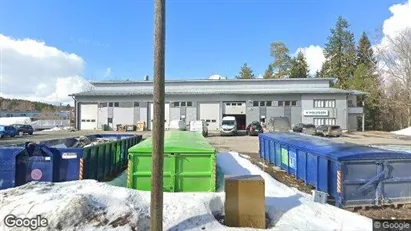
Warehouse in Randers NV, Randers
 More info
Warehouse in Randers NV, Randers
Warehouse for rent in Randers NV, Randers
Areal
Ca. 1,770 m2
Pris pr. md.
Ca. 29,500 DKK pr md
Område
Randers NV, Randers
Type
Warehouse
Warehouse in Randers NV, Randers
More info
Warehouse in Randers NV, Randers
Warehouse for rent in Randers NV, Randers
Areal
Ca. 500 m2
Pris pr. md.
Ca. 8,350 DKK pr md
Område
Randers NV, Randers
Type
Warehouse
Selected customers
30,000 customers use Companyspace.com
30,000 customers
285,000 companies in our database
2,400 rentals annually
Companyspace.com is used by thousands of landlords, property companies, commercial real estate agents, investors and business centres seeking greater visibility, more enquiries and lower vacancy rates.


