


Industrial properties in Europe
Companyspace.com today:
New today 2,965
Updated 24h 3,123
Notifications about new companyspaces2,183
Copenhagen +6
Stockholm +10
Amsterdam +3
Berlin +3
Vienna +6
Paris +5
Madrid +4
Dublin (county) +23
Warsaw +19
Greater London +14
Latest update 1 h ago
Active ads 369,199
19,091 industrial properties found
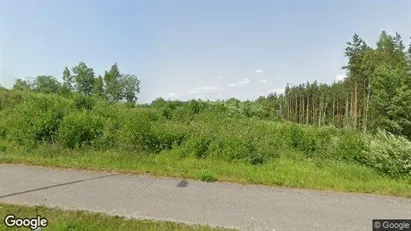
Industrial property in Lieto, Varsinais-Suomi
 More info
Industrial property in Lieto, Varsinais-Suomi
Industrial property for rent in Lieto, Varsinais-Suomi
Areal
Ca. 300 m2
Pris pr. md.
Ca. 2,300 EUR pr md
Område
Lieto, Varsinais-Suomi
Type
Industrial property
Office space in Tilst, Aarhus
 More info
Office space in Tilst, Aarhus
Office space for rent in Tilst, Aarhus
Areal
Ca. 525 m2
Pris pr. md.
Ca. 28,750 DKK pr md
Område
Tilst, Aarhus
Type
Office space
Industrial property in Genk, Limburg
 More info
Industrial property in Genk, Limburg
Industrial property for sale in Genk, Limburg
Areal
Ca. 5,000 m2
Pris
Ca. 4,500,000EUR
Område
Genk, Limburg
Type
Industrial property
Warehouse in Randers SV, Central Jutland Region
More info
Warehouse in Randers SV, Central Jutland Region
Warehouse for rent in Randers SV, Central Jutland Region
Areal
Ca. 12,200 m2
Pris pr. md.
Ca. 478,150 DKK pr md
Område
Randers SV, Central Jutland Region
Type
Warehouse
Warehouse in Albertslund, Greater Copenhagen
More info
Warehouse in Albertslund, Greater Copenhagen
Warehouse for rent in Albertslund, Greater Copenhagen
Areal
Ca. 14,000 m2
Pris pr. md.
Ca. 542,500 DKK pr md
Område
Albertslund, Greater Copenhagen
Type
Warehouse
Warehouse in Nørresundby, North Jutland Region
More info
Warehouse in Nørresundby, North Jutland Region
Warehouse for rent in Nørresundby, North Jutland Region
Areal
Ca. 440 m2
Pris pr. md.
Ca. 23,000 DKK pr md
Område
Nørresundby, North Jutland Region
Type
Warehouse
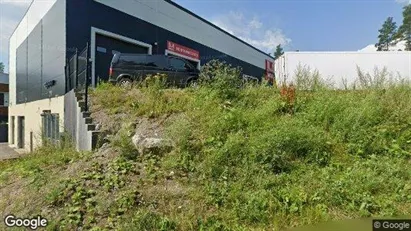
Industrial property in Vantaa, Uusimaa
 More info
Industrial property in Vantaa, Uusimaa
Industrial property for rent in Vantaa, Uusimaa
Areal
Ca. 75 m2
Pris pr. md.
Ca. 900 EUR pr md
Område
Vantaa, Uusimaa
Type
Industrial property
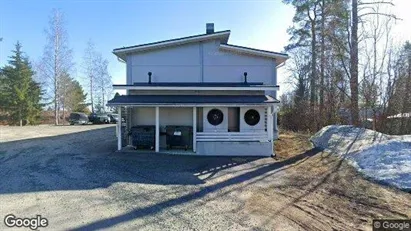
Industrial property in Lohja, Uusimaa
 More info
Industrial property in Lohja, Uusimaa
Industrial property for rent in Lohja, Uusimaa
Areal
-
Pris pr. md.
Ca. 1,000 EUR pr md
Område
Lohja, Uusimaa
Type
Industrial property
Warehouse in Albertslund, Greater Copenhagen
More info
Warehouse in Albertslund, Greater Copenhagen
Warehouse for rent in Albertslund, Greater Copenhagen
Areal
Ca. 5,000 m2
Pris pr. md.
Ca. 193,750 DKK pr md
Område
Albertslund, Greater Copenhagen
Type
Warehouse
Warehouse in Albertslund, Greater Copenhagen
More info
Warehouse in Albertslund, Greater Copenhagen
Warehouse for rent in Albertslund, Greater Copenhagen
Areal
Ca. 12,000 m2
Pris pr. md.
Ca. 465,000 DKK pr md
Område
Albertslund, Greater Copenhagen
Type
Warehouse
Warehouse in Albertslund, Greater Copenhagen
More info
Warehouse in Albertslund, Greater Copenhagen
Warehouse for rent in Albertslund, Greater Copenhagen
Areal
Ca. 22,085 m2
Pris pr. md.
Ca. 387,500 DKK pr md
Område
Albertslund, Greater Copenhagen
Type
Warehouse
Warehouse in Albertslund, Greater Copenhagen
More info
Warehouse in Albertslund, Greater Copenhagen
Warehouse for rent in Albertslund, Greater Copenhagen
Areal
Ca. 16,000 m2
Pris pr. md.
Ca. 620,000 DKK pr md
Område
Albertslund, Greater Copenhagen
Type
Warehouse
Warehouse in Albertslund, Greater Copenhagen
More info
Warehouse in Albertslund, Greater Copenhagen
Warehouse for rent in Albertslund, Greater Copenhagen
Areal
Ca. 6,000 m2
Pris pr. md.
Ca. 232,500 DKK pr md
Område
Albertslund, Greater Copenhagen
Type
Warehouse
Warehouse in Albertslund, Greater Copenhagen
More info
Warehouse in Albertslund, Greater Copenhagen
Warehouse for rent in Albertslund, Greater Copenhagen
Areal
Ca. 4,000 m2
Pris pr. md.
Ca. 155,000 DKK pr md
Område
Albertslund, Greater Copenhagen
Type
Warehouse
Warehouse in Albertslund, Greater Copenhagen
More info
Warehouse in Albertslund, Greater Copenhagen
Warehouse for rent in Albertslund, Greater Copenhagen
Areal
Ca. 8,000 m2
Pris pr. md.
Ca. 310,000 DKK pr md
Område
Albertslund, Greater Copenhagen
Type
Warehouse
Industrial property in Siilinjärvi, Pohjois-Savo
 More info
Industrial property in Siilinjärvi, Pohjois-Savo
Industrial property for rent in Siilinjärvi, Pohjois-Savo
Areal
Ca. 80 m2
Pris pr. md.
Ca. 700 EUR pr md
Område
Siilinjärvi, Pohjois-Savo
Type
Industrial property
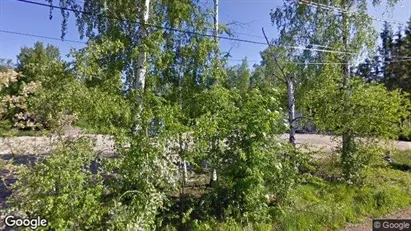
Industrial property in Lieto, Varsinais-Suomi
 More info
Industrial property in Lieto, Varsinais-Suomi
Industrial property for rent in Lieto, Varsinais-Suomi
Areal
Ca. 385 m2
Pris pr. md.
Ca. 2,500 EUR pr md
Område
Lieto, Varsinais-Suomi
Type
Industrial property
Industrial property in Alingsås, Västra Götaland County
More info
Industrial property in Alingsås, Västra Götaland County
Industrial property for rent in Alingsås, Västra Götaland County
Areal
Ca. 70 m2
Pris pr. md.
Ca. 500 SEK pr md
Område
Alingsås, Västra Götaland County
Type
Industrial property
Selected customers
30,000 customers use Companyspace.com
30,000 customers
285,000 companies in our database
2,400 rentals annually
Companyspace.com is used by thousands of landlords, property companies, commercial real estate agents, investors and business centres seeking greater visibility, more enquiries and lower vacancy rates.


