


Industrial properties in Europe
Companyspace.com today:
New today 2,911
Updated 24h 3,925
Notifications about new companyspaces2,086
Copenhagen +4
Stockholm +1
Amsterdam +3
Berlin +3
Vienna +6
Paris +5
Madrid +4
Dublin (county) +23
Warsaw +19
Greater London +13
Latest update 23 min ago
Active ads 369,195
19,085 industrial properties found
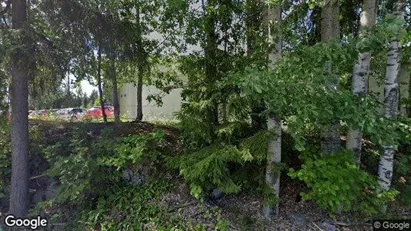
Industrial property in Tampere Luoteinen, Tampere
 More info
Industrial property in Tampere Luoteinen, Tampere
Industrial property for rent in Tampere Luoteinen, Tampere
Areal
Ca. 260 m2
Pris pr. md.
Ca. 1,550 EUR pr md
Område
Tampere Luoteinen, Tampere
Type
Industrial property
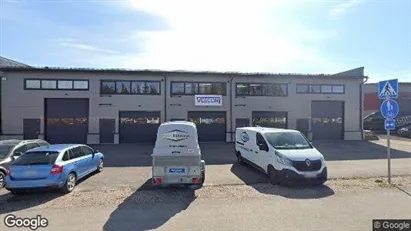
Office space in Aarhus N, Aarhus
 More info
Office space in Aarhus N, Aarhus
Office space for rent in Aarhus N, Aarhus
Areal
Ca. 595 m2
Pris pr. md.
Ca. 23,600 DKK pr md
Område
Aarhus N, Aarhus
Type
Office space
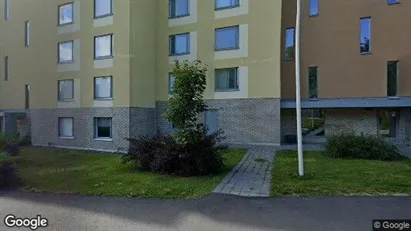
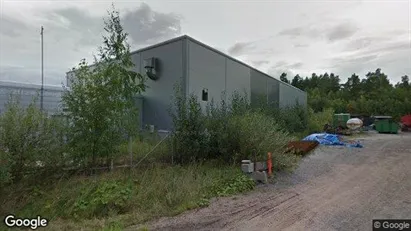
Industrial property in Espoo, Uusimaa
 More info
Industrial property in Espoo, Uusimaa
Industrial property for rent in Espoo, Uusimaa
Areal
Ca. 70 m2
Pris pr. md.
Ca. 700 EUR pr md
Område
Espoo, Uusimaa
Type
Industrial property
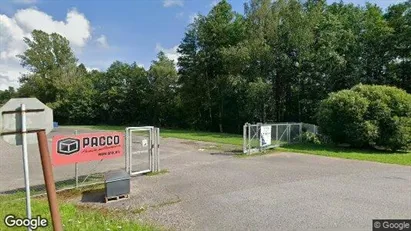
Industrial property in Raasepori, Uusimaa
 More info
Industrial property in Raasepori, Uusimaa
Industrial property for rent in Raasepori, Uusimaa
Areal
Ca. 15 m2
Pris pr. md.
Ca. 150 EUR pr md
Område
Raasepori, Uusimaa
Type
Industrial property
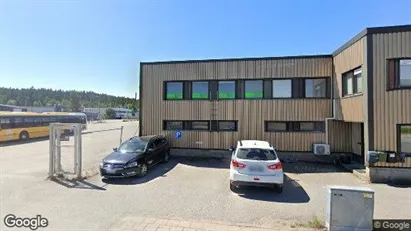
Industrial property in Turku, Varsinais-Suomi
 More info
Industrial property in Turku, Varsinais-Suomi
Industrial property for rent in Turku, Varsinais-Suomi
Areal
Ca. 500 m2
Pris pr. md.
Ca. 5,900 EUR pr md
Område
Turku, Varsinais-Suomi
Type
Industrial property
Industrial property in Raasepori, Uusimaa
 More info
Industrial property in Raasepori, Uusimaa
Industrial property for rent in Raasepori, Uusimaa
Areal
1,514 - 3,000 m2
Pris pr. md.
Ca. 7,500 EUR pr md
Område
Raasepori, Uusimaa
Type
Industrial property
Industrial property in Turku, Varsinais-Suomi
 More info
Industrial property in Turku, Varsinais-Suomi
Industrial property for rent in Turku, Varsinais-Suomi
Areal
Ca. 600 m2
Pris pr. md.
Ca. 4,150 EUR pr md
Område
Turku, Varsinais-Suomi
Type
Industrial property
Industrial property in Vordingborg, Region Zealand
More info
Industrial property in Vordingborg, Region Zealand
Industrial property for rent in Vordingborg, Region Zealand
Areal
Ca. 550 m2
Pris pr. md.
Ca. 15,000 DKK pr md
Område
Vordingborg, Region Zealand
Type
Industrial property
Industrial property in Vordingborg, Region Zealand
More info
Industrial property in Vordingborg, Region Zealand
Industrial property for rent in Vordingborg, Region Zealand
Areal
Ca. 550 m2
Pris pr. md.
Ca. 15,000 DKK pr md
Område
Vordingborg, Region Zealand
Type
Industrial property
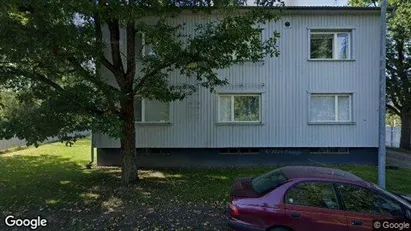
Industrial property in Salo, Varsinais-Suomi
 More info
Industrial property in Salo, Varsinais-Suomi
Industrial property for rent in Salo, Varsinais-Suomi
Areal
Ca. 10 m2
Pris pr. md.
Ca. 100 EUR pr md
Område
Salo, Varsinais-Suomi
Type
Industrial property
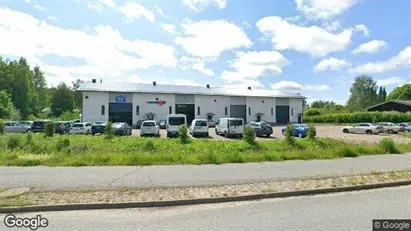
Industrial property in Kuopio, Pohjois-Savo
 More info
Industrial property in Kuopio, Pohjois-Savo
Industrial property for rent in Kuopio, Pohjois-Savo
Areal
Ca. 430 m2
Pris pr. md.
Ca. 3,000 EUR pr md
Område
Kuopio, Pohjois-Savo
Type
Industrial property
Industrial property in Turku, Varsinais-Suomi
 More info
Industrial property in Turku, Varsinais-Suomi
Industrial property for rent in Turku, Varsinais-Suomi
Areal
Ca. 320 m2
Pris pr. md.
Ca. 2,500 EUR pr md
Område
Turku, Varsinais-Suomi
Type
Industrial property
Industrial property in Raisio, Varsinais-Suomi
 More info
Industrial property in Raisio, Varsinais-Suomi
Industrial property for rent in Raisio, Varsinais-Suomi
Areal
Ca. 825 m2
Pris pr. md.
Ca. 7,450 EUR pr md
Område
Raisio, Varsinais-Suomi
Type
Industrial property
Warehouse in Ry, Central Jutland Region
More info
Warehouse in Ry, Central Jutland Region
Warehouse for rent in Ry, Central Jutland Region
Areal
Ca. 120 m2
Pris pr. md.
Ca. 6,100 DKK pr md
Område
Ry, Central Jutland Region
Type
Warehouse
Industrial property in Vihti, Uusimaa
 More info
Industrial property in Vihti, Uusimaa
Industrial property for rent in Vihti, Uusimaa
Areal
Ca. 375 m2
Pris pr. md.
Ca. 4,150 EUR pr md
Område
Vihti, Uusimaa
Type
Industrial property
Industrial property in Espoo, Uusimaa
 More info
Industrial property in Espoo, Uusimaa
Industrial property for rent in Espoo, Uusimaa
Areal
133 - 267 m2
Pris pr. md.
Ca. 1,200 EUR pr md
Område
Espoo, Uusimaa
Type
Industrial property
Industrial property in Nurmijärvi, Uusimaa
 More info
Industrial property in Nurmijärvi, Uusimaa
Industrial property for rent in Nurmijärvi, Uusimaa
Areal
Ca. 890 m2
Pris pr. md.
Ca. 8,150 EUR pr md
Område
Nurmijärvi, Uusimaa
Type
Industrial property
Industrial property in Hämeenlinna, Kanta-Häme
 More info
Industrial property in Hämeenlinna, Kanta-Häme
Industrial property for rent in Hämeenlinna, Kanta-Häme
Areal
Ca. 180 m2
Pris pr. md.
Ca. 1,500 EUR pr md
Område
Hämeenlinna, Kanta-Häme
Type
Industrial property
Selected customers
30,000 customers use Companyspace.com
30,000 customers
285,000 companies in our database
2,400 rentals annually
Companyspace.com is used by thousands of landlords, property companies, commercial real estate agents, investors and business centres seeking greater visibility, more enquiries and lower vacancy rates.


