


Industrial properties in Europe
Companyspace.com today:
New today 2,911
Updated 24h 3,925
Notifications about new companyspaces2,086
Copenhagen +4
Stockholm +1
Amsterdam +3
Berlin +3
Vienna +6
Paris +5
Madrid +4
Dublin (county) +23
Warsaw +19
Greater London +13
Latest update 23 min ago
Active ads 369,195
19,085 industrial properties found
Industrial property in Vihti, Uusimaa
 More info
Industrial property in Vihti, Uusimaa
Industrial property for rent in Vihti, Uusimaa
Areal
Ca. 100 m2
Pris pr. md.
Ca. 900 EUR pr md
Område
Vihti, Uusimaa
Type
Industrial property
Industrial property in Bilzen, Limburg
 More info
Industrial property in Bilzen, Limburg
Industrial property for sale in Bilzen, Limburg
Areal
Ca. 170 m2
Pris
Ca. 295,000EUR
Område
Bilzen, Limburg
Type
Industrial property
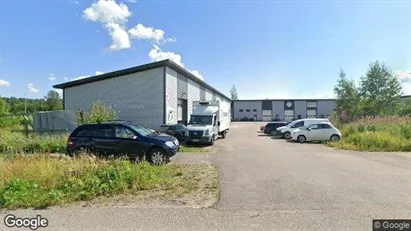
Industrial property in Lieto, Varsinais-Suomi
 More info
Industrial property in Lieto, Varsinais-Suomi
Industrial property for rent in Lieto, Varsinais-Suomi
Areal
Ca. 575 m2
Pris pr. md.
Ca. 3,350 EUR pr md
Område
Lieto, Varsinais-Suomi
Type
Industrial property
Industrial property in Værløse, North Zealand
 More info
Industrial property in Værløse, North Zealand
Industrial property for rent in Værløse, North Zealand
Areal
Ca. 195 m2
Pris pr. md.
Ca. 14,650 DKK pr md
Område
Værløse, North Zealand
Type
Industrial property
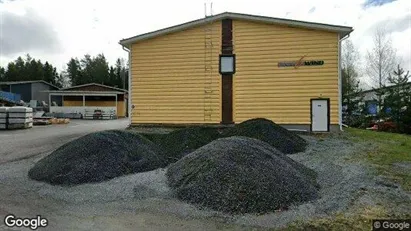
Warehouse in Tornio, Lappi
 More info
Warehouse in Tornio, Lappi
Warehouse for rent in Tornio, Lappi
Areal
-
Pris pr. md.
Ca. 1,400 EUR pr md
Område
Tornio, Lappi
Type
Warehouse
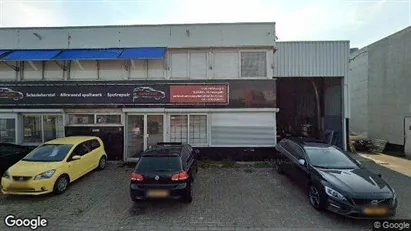
Industrial property in Nieuwegein, Province of Utrecht
 More info
Industrial property in Nieuwegein, Province of Utrecht
Industrial property for sale in Nieuwegein, Province of Utrecht
Areal
Ca. 50 m2
Pris
Ca. 20,000EUR
Område
Nieuwegein, Province of Utrecht
Type
Industrial property
Industrial property in Værløse, North Zealand
More info
Industrial property in Værløse, North Zealand
Industrial property for rent in Værløse, North Zealand
Areal
Ca. 210 m2
Pris pr. md.
Ca. 15,750 DKK pr md
Område
Værløse, North Zealand
Type
Industrial property
Industrial property in Kvistgård, North Zealand
More info
Industrial property in Kvistgård, North Zealand
Industrial property for rent in Kvistgård, North Zealand
Areal
Ca. 750 m2
Pris pr. md.
Ca. 50,000 DKK pr md
Område
Kvistgård, North Zealand
Type
Industrial property
Industrial property in Lempäälä, Pirkanmaa
 More info
Industrial property in Lempäälä, Pirkanmaa
Industrial property for rent in Lempäälä, Pirkanmaa
Areal
Ca. 210 m2
Pris pr. md.
Not stated
Område
Lempäälä, Pirkanmaa
Type
Industrial property
Industrial property in Værløse, North Zealand
More info
Industrial property in Værløse, North Zealand
Industrial property for rent in Værløse, North Zealand
Areal
Ca. 155 m2
Pris pr. md.
Ca. 9,000 DKK pr md
Område
Værløse, North Zealand
Type
Industrial property
Industrial property in Helsingør, North Zealand
More info
Industrial property in Helsingør, North Zealand
Industrial property for rent in Helsingør, North Zealand
Areal
Ca. 100 m2
Pris pr. md.
Ca. 8,150 DKK pr md
Område
Helsingør, North Zealand
Type
Industrial property
Industrial property in Værløse, North Zealand
More info
Industrial property in Værløse, North Zealand
Industrial property for rent in Værløse, North Zealand
Areal
Ca. 45 m2
Pris pr. md.
Ca. 4,500 DKK pr md
Område
Værløse, North Zealand
Type
Industrial property
Industrial property in Værløse, North Zealand
More info
Industrial property in Værløse, North Zealand
Industrial property for rent in Værløse, North Zealand
Areal
Ca. 400 m2
Pris pr. md.
Ca. 30,000 DKK pr md
Område
Værløse, North Zealand
Type
Industrial property
Industrial property in Bilzen, Limburg
 More info
Industrial property in Bilzen, Limburg
Industrial property for sale in Bilzen, Limburg
Areal
Ca. 405 m2
Pris
Ca. 625,000EUR
Område
Bilzen, Limburg
Type
Industrial property
Industrial property in Pori, Satakunta
 More info
Industrial property in Pori, Satakunta
Industrial property for rent in Pori, Satakunta
Areal
Ca. 140 m2
Pris pr. md.
Ca. 650 EUR pr md
Område
Pori, Satakunta
Type
Industrial property
Industrial property in Coslada, Comunidad de Madrid
 More info
Industrial property in Coslada, Comunidad de Madrid
Industrial property for rent in Coslada, Comunidad de Madrid
Areal
Ca. 2,500 m2
Pris pr. md.
Ca. 9,000 EUR pr md
Område
Coslada, Comunidad de Madrid
Type
Industrial property
Industrial property in Genk, Limburg
 More info
Industrial property in Genk, Limburg
Industrial property for sale in Genk, Limburg
Areal
-
Pris
Ca. 1,200,000EUR
Område
Genk, Limburg
Type
Industrial property
Industrial property in Maaseik, Limburg
 More info
Industrial property in Maaseik, Limburg
Industrial property for sale in Maaseik, Limburg
Areal
Ca. 375 m2
Pris
Ca. 432,000EUR
Område
Maaseik, Limburg
Type
Industrial property
Selected customers
30,000 customers use Companyspace.com
30,000 customers
285,000 companies in our database
2,400 rentals annually
Companyspace.com is used by thousands of landlords, property companies, commercial real estate agents, investors and business centres seeking greater visibility, more enquiries and lower vacancy rates.


