


Industrial properties in Europe
Companyspace.com today:
New today 2,965
Updated 24h 3,039
Notifications about new companyspaces2,189
Copenhagen +6
Stockholm +10
Amsterdam +3
Berlin +3
Vienna +6
Paris +5
Madrid +4
Dublin (county) +23
Warsaw +19
Greater London +14
Latest update 2 h ago
Active ads 369,199
19,091 industrial properties found
Warehouse in Copenhagen SV, Copenhagen
 More info
Warehouse in Copenhagen SV, Copenhagen
Warehouse for rent in Copenhagen SV, Copenhagen
Areal
Ca. 1,910 m2
Pris pr. md.
Ca. 142,500 DKK pr md
Område
Copenhagen SV, Copenhagen
Type
Warehouse
Industrial property in Enschede, Overijssel
 More info
Industrial property in Enschede, Overijssel
Productie te koop in Enschede, Overijssel
Areal
Ca. 120 m2
Pris
Ca. 173,000EUR
Område
Enschede, Overijssel
Type
Industrial property
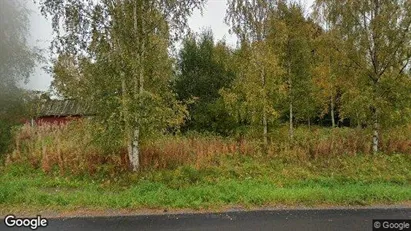
Industrial property in Pirkkala, Pirkanmaa
 More info
Industrial property in Pirkkala, Pirkanmaa
Industrial property for rent in Pirkkala, Pirkanmaa
Areal
Ca. 300 m2
Pris pr. md.
Ca. 2,100 EUR pr md
Område
Pirkkala, Pirkanmaa
Type
Industrial property
Industrial property in Mäntsälä, Uusimaa
 More info
Industrial property in Mäntsälä, Uusimaa
Industrial property for rent in Mäntsälä, Uusimaa
Areal
Ca. 170 m2
Pris pr. md.
Ca. 1,400 EUR pr md
Område
Mäntsälä, Uusimaa
Type
Industrial property
Industrial property in Kouvola, Kymenlaakso
 More info
Industrial property in Kouvola, Kymenlaakso
Industrial property for rent in Kouvola, Kymenlaakso
Areal
50 - 354 m2
Pris pr. md.
Ca. 2,100 EUR pr md
Område
Kouvola, Kymenlaakso
Type
Industrial property
Warehouse in Hillerød, North Zealand
 More info
Warehouse in Hillerød, North Zealand
Warehouse for rent in Hillerød, North Zealand
Areal
Ca. 1,100 m2
Pris pr. md.
Ca. 73,350 DKK pr md
Område
Hillerød, North Zealand
Type
Warehouse
Warehouse in Albertslund, Greater Copenhagen
More info
Warehouse in Albertslund, Greater Copenhagen
Warehouse for rent in Albertslund, Greater Copenhagen
Areal
Ca. 22,085 m2
Pris pr. md.
Ca. 936,900 DKK pr md
Område
Albertslund, Greater Copenhagen
Type
Warehouse
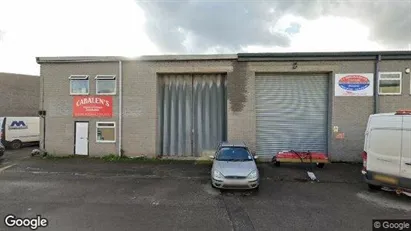
Industrial property in Stoke-on-Trent - Staffordshire, West Midlands
 More info
Industrial property in Stoke-on-Trent - Staffordshire, West Midlands
Production for rent in Stoke-on-Trent - Staffordshire, West Midlands
Areal
-
Pris pr. md.
Ca. 2,050 GBP pr md
Område
Stoke-on-Trent - Staffordshire, West Midlands
Type
Industrial property
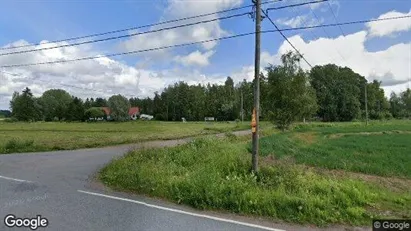
Industrial property in Kalajoki, Pohjois-Pohjanmaa
 More info
Industrial property in Kalajoki, Pohjois-Pohjanmaa
Industrial property for rent in Kalajoki, Pohjois-Pohjanmaa
Areal
Ca. 100 m2
Pris pr. md.
Ca. 1,500 EUR pr md
Område
Kalajoki, Pohjois-Pohjanmaa
Type
Industrial property
Industrial property in Pori, Satakunta
 More info
Industrial property in Pori, Satakunta
Industrial property for rent in Pori, Satakunta
Areal
Ca. 100 m2
Pris pr. md.
Ca. 500 EUR pr md
Område
Pori, Satakunta
Type
Industrial property
Industrial property in Slagelse, Region Zealand
More info
Industrial property in Slagelse, Region Zealand
Industrial property for rent in Slagelse, Region Zealand
Areal
Ca. 310 m2
Pris pr. md.
Ca. 9,000 DKK pr md
Område
Slagelse, Region Zealand
Type
Industrial property
Warehouse in Ishøj, Greater Copenhagen
More info
Warehouse in Ishøj, Greater Copenhagen
Warehouse for rent in Ishøj, Greater Copenhagen
Areal
Ca. 13,670 m2
Pris pr. md.
Ca. 893,050 DKK pr md
Område
Ishøj, Greater Copenhagen
Type
Warehouse
Warehouse in Haslev, Region Zealand
More info
Warehouse in Haslev, Region Zealand
Warehouse for rent in Haslev, Region Zealand
Areal
Ca. 270 m2
Pris pr. md.
Ca. 11,000 DKK pr md
Område
Haslev, Region Zealand
Type
Warehouse
Warehouse in Hørning, Central Jutland Region
More info
Warehouse in Hørning, Central Jutland Region
Warehouse for rent in Hørning, Central Jutland Region
Areal
Ca. 225 m2
Pris pr. md.
Ca. 7,950 DKK pr md
Område
Hørning, Central Jutland Region
Type
Warehouse
Industrial property in Enschede, Overijssel
 More info
Industrial property in Enschede, Overijssel
Productie te koop in Enschede, Overijssel
Areal
Ca. 120 m2
Pris
Ca. 173,000EUR
Område
Enschede, Overijssel
Type
Industrial property
Warehouse in Brabrand, Aarhus
More info
Warehouse in Brabrand, Aarhus
Warehouse for rent in Brabrand, Aarhus
Areal
Ca. 2,400 m2
Pris pr. md.
Ca. 160,000 DKK pr md
Område
Brabrand, Aarhus
Type
Warehouse
Warehouse in Ballerup, Greater Copenhagen
More info
Warehouse in Ballerup, Greater Copenhagen
Warehouse for rent in Ballerup, Greater Copenhagen
Areal
Ca. 115 m2
Pris pr. md.
Ca. 4,100 DKK pr md
Område
Ballerup, Greater Copenhagen
Type
Warehouse
Industrial property in Bridgend - Mid Glamorgan, Cardiff (Region)
 More info
Industrial property in Bridgend - Mid Glamorgan, Cardiff (Region)
Production for rent in Bridgend - Mid Glamorgan, Cardiff (Region)
Areal
-
Pris pr. md.
Ca. 1,950 GBP pr md
Område
Bridgend - Mid Glamorgan, Cardiff (Region)
Type
Industrial property
Selected customers
30,000 customers use Companyspace.com
30,000 customers
285,000 companies in our database
2,400 rentals annually
Companyspace.com is used by thousands of landlords, property companies, commercial real estate agents, investors and business centres seeking greater visibility, more enquiries and lower vacancy rates.


