


Industrial properties in Europe
Companyspace.com today:
New today 2,911
Updated 24h 3,925
Notifications about new companyspaces2,086
Copenhagen +4
Stockholm +1
Amsterdam +3
Berlin +3
Vienna +6
Paris +5
Madrid +4
Dublin (county) +23
Warsaw +19
Greater London +13
Latest update 23 min ago
Active ads 369,195
19,085 industrial properties found
Office space in Kalundborg, Region Zealand
 More info
Office space in Kalundborg, Region Zealand
Office space for rent in Kalundborg, Region Zealand
Areal
Ca. 620 m2
Pris pr. md.
Ca. 5,200 DKK pr md
Område
Kalundborg, Region Zealand
Type
Office space
Office space in Kalundborg, Region Zealand
More info
Office space in Kalundborg, Region Zealand
Office space for rent in Kalundborg, Region Zealand
Areal
Ca. 1,395 m2
Pris pr. md.
Ca. 11,650 DKK pr md
Område
Kalundborg, Region Zealand
Type
Office space
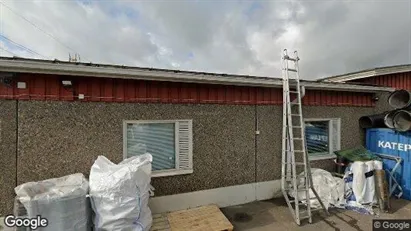
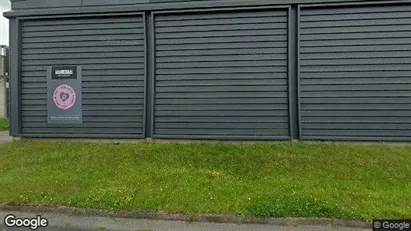
Warehouse in Haslev, Region Zealand
More info
Warehouse in Haslev, Region Zealand
Warehouse for rent in Haslev, Region Zealand
Areal
Ca. 270 m2
Pris pr. md.
Ca. 11,000 DKK pr md
Område
Haslev, Region Zealand
Type
Warehouse
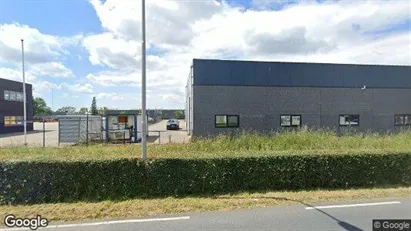
Industrial property in Hulst, Zeeland
 More info
Industrial property in Hulst, Zeeland
Industrial property for rent in Hulst, Zeeland
Areal
-
Pris pr. md.
Ca. 800 EUR pr md
Område
Hulst, Zeeland
Type
Industrial property
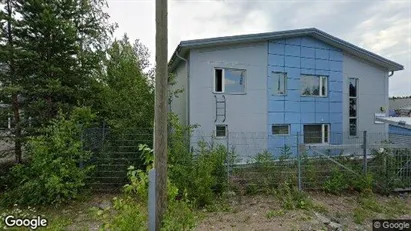
Office space in Kalundborg, Region Zealand
More info
Office space in Kalundborg, Region Zealand
Office space for rent in Kalundborg, Region Zealand
Areal
Ca. 680 m2
Pris pr. md.
Ca. 6,500 DKK pr md
Område
Kalundborg, Region Zealand
Type
Office space
Warehouse in Kalundborg, Region Zealand
More info
Warehouse in Kalundborg, Region Zealand
Warehouse for rent in Kalundborg, Region Zealand
Areal
Ca. 6,215 m2
Pris pr. md.
Ca. 181,300 DKK pr md
Område
Kalundborg, Region Zealand
Type
Warehouse
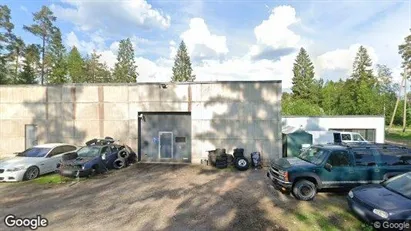
Industrial property in Tampere Eteläinen, Tampere
 More info
Industrial property in Tampere Eteläinen, Tampere
Industrial property for rent in Tampere Eteläinen, Tampere
Areal
Ca. 330 m2
Pris pr. md.
Ca. 3,950 EUR pr md
Område
Tampere Eteläinen, Tampere
Type
Industrial property
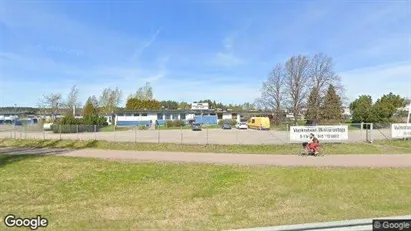
Warehouse in Sorø, Region Zealand
More info
Warehouse in Sorø, Region Zealand
Warehouse for rent in Sorø, Region Zealand
Areal
Ca. 1,345 m2
Pris pr. md.
Ca. 33,700 DKK pr md
Område
Sorø, Region Zealand
Type
Warehouse
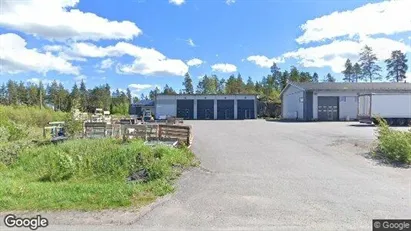
Warehouse in Åbyhøj, Aarhus
More info
Warehouse in Åbyhøj, Aarhus
Warehouse for rent in Åbyhøj, Aarhus
Areal
Ca. 1,990 m2
Pris pr. md.
Ca. 122,000 DKK pr md
Område
Åbyhøj, Aarhus
Type
Warehouse
Industrial property in Tuusula, Uusimaa
 More info
Industrial property in Tuusula, Uusimaa
Industrial property for rent in Tuusula, Uusimaa
Areal
Ca. 200 m2
Pris pr. md.
Ca. 1,750 EUR pr md
Område
Tuusula, Uusimaa
Type
Industrial property
Industrial property in Paimio, Varsinais-Suomi
 More info
Industrial property in Paimio, Varsinais-Suomi
Industrial property for rent in Paimio, Varsinais-Suomi
Areal
Ca. 145 m2
Pris pr. md.
Ca. 600 EUR pr md
Område
Paimio, Varsinais-Suomi
Type
Industrial property
Industrial property in Lieto, Varsinais-Suomi
 More info
Industrial property in Lieto, Varsinais-Suomi
Industrial property for rent in Lieto, Varsinais-Suomi
Areal
Ca. 315 m2
Pris pr. md.
Ca. 2,050 EUR pr md
Område
Lieto, Varsinais-Suomi
Type
Industrial property
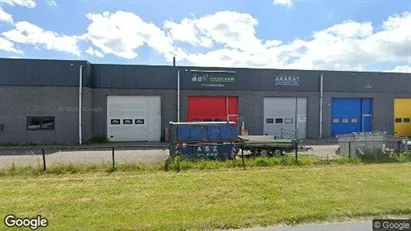
Industrial property in Roeselare, West-Vlaanderen
 More info
Industrial property in Roeselare, West-Vlaanderen
Industrial property for rent in Roeselare, West-Vlaanderen
Areal
Ca. 2,065 m2
Pris pr. md.
Ca. 7,500 EUR pr md
Område
Roeselare, West-Vlaanderen
Type
Industrial property
Industrial property in Haderslev, Region of Southern Denmark
 More info
Industrial property in Haderslev, Region of Southern Denmark
Industrial property for rent in Haderslev, Region of Southern Denmark
Areal
Ca. 4,045 m2
Pris pr. md.
Ca. 111,000 DKK pr md
Område
Haderslev, Region of Southern Denmark
Type
Industrial property
Industrial property in Raisio, Varsinais-Suomi
 More info
Industrial property in Raisio, Varsinais-Suomi
Industrial property for rent in Raisio, Varsinais-Suomi
Areal
Ca. 300 m2
Pris pr. md.
Ca. 1,800 EUR pr md
Område
Raisio, Varsinais-Suomi
Type
Industrial property
Industrial property in Sluis, Zeeland
 More info
Industrial property in Sluis, Zeeland
Industrial property for rent in Sluis, Zeeland
Areal
-
Pris pr. md.
Ca. 850 EUR pr md
Område
Sluis, Zeeland
Type
Industrial property
Industrial property in Sluis, Zeeland
 More info
Industrial property in Sluis, Zeeland
Industrial property for rent in Sluis, Zeeland
Areal
-
Pris pr. md.
Ca. 500 EUR pr md
Område
Sluis, Zeeland
Type
Industrial property
Industrial property in Raasepori, Uusimaa
 More info
Industrial property in Raasepori, Uusimaa
Industrial property for rent in Raasepori, Uusimaa
Areal
Ca. 1,800 m2
Pris pr. md.
Ca. 8,100 EUR pr md
Område
Raasepori, Uusimaa
Type
Industrial property
Selected customers
30,000 customers use Companyspace.com
30,000 customers
285,000 companies in our database
2,400 rentals annually
Companyspace.com is used by thousands of landlords, property companies, commercial real estate agents, investors and business centres seeking greater visibility, more enquiries and lower vacancy rates.


