


Industrial properties in Europe
Companyspace.com today:
New today 2,965
Updated 24h 3,039
Notifications about new companyspaces2,189
Copenhagen +6
Stockholm +10
Amsterdam +3
Berlin +3
Vienna +6
Paris +5
Madrid +4
Dublin (county) +23
Warsaw +19
Greater London +14
Latest update 2 h ago
Active ads 369,199
19,091 industrial properties found
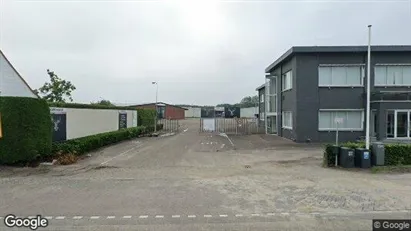
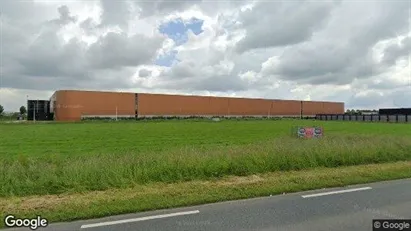
Industrial property in Hulst, Zeeland
 More info
Industrial property in Hulst, Zeeland
Industrial property for rent in Hulst, Zeeland
Areal
-
Pris pr. md.
Ca. 5,500 EUR pr md
Område
Hulst, Zeeland
Type
Industrial property
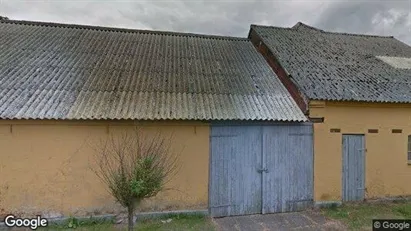
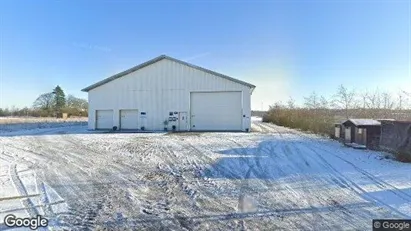
Warehouse in Børkop, Region of Southern Denmark
 More info
Warehouse in Børkop, Region of Southern Denmark
Warehouse for rent in Børkop, Region of Southern Denmark
Areal
Ca. 400 m2
Pris pr. md.
Ca. 13,350 DKK pr md
Område
Børkop, Region of Southern Denmark
Type
Warehouse
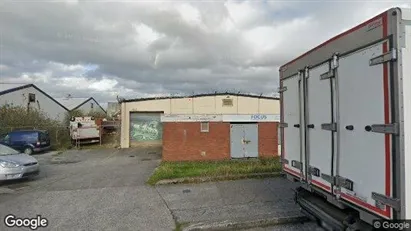
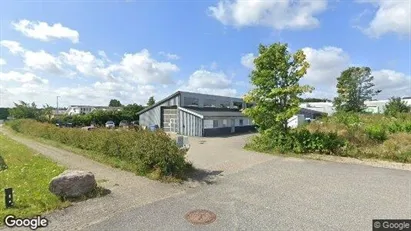
Industrial property in Dublin 11, Dublin
 More info
Industrial property in Dublin 11, Dublin
Industrial property for sale in Dublin 11, Dublin
Areal
Ca. 540 m2
Pris
Ca. 870,000EUR
Område
Dublin 11, Dublin
Type
Industrial property
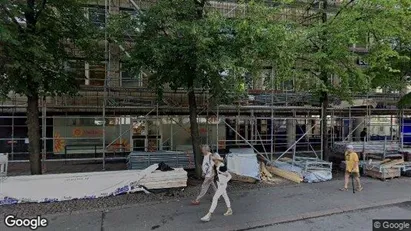
Industrial property in Helsinki Eteläinen, Helsinki
 More info
Industrial property in Helsinki Eteläinen, Helsinki
Industrial property for rent in Helsinki Eteläinen, Helsinki
Areal
Ca. 45 m2
Pris pr. md.
Ca. 1,200 EUR pr md
Område
Helsinki Eteläinen, Helsinki
Type
Industrial property
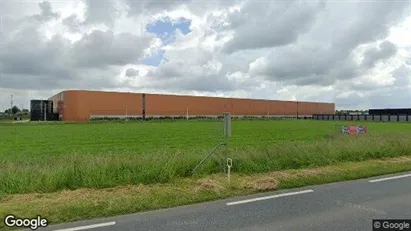
Industrial property in Hulst, Zeeland
 More info
Industrial property in Hulst, Zeeland
Industrial property for rent in Hulst, Zeeland
Areal
-
Pris pr. md.
Ca. 1,450 EUR pr md
Område
Hulst, Zeeland
Type
Industrial property
Industrial property in Hulst, Zeeland
 More info
Industrial property in Hulst, Zeeland
Industrial property for rent in Hulst, Zeeland
Areal
-
Pris pr. md.
Ca. 1,650 EUR pr md
Område
Hulst, Zeeland
Type
Industrial property
Warehouse in Kalundborg, Region Zealand
 More info
Warehouse in Kalundborg, Region Zealand
Warehouse for rent in Kalundborg, Region Zealand
Areal
Ca. 225 m2
Pris pr. md.
Not stated
Område
Kalundborg, Region Zealand
Type
Warehouse
Warehouse in Hinnerup, Central Jutland Region
 More info
Warehouse in Hinnerup, Central Jutland Region
Warehouse for rent in Hinnerup, Central Jutland Region
Areal
Ca. 490 m2
Pris pr. md.
Ca. 22,900 DKK pr md
Område
Hinnerup, Central Jutland Region
Type
Warehouse
Warehouse in Horsens, Central Jutland Region
 More info
Warehouse in Horsens, Central Jutland Region
Warehouse for rent in Horsens, Central Jutland Region
Areal
Ca. 650 m2
Pris pr. md.
Ca. 28,000 DKK pr md
Område
Horsens, Central Jutland Region
Type
Warehouse
Office space in Aarhus C, Aarhus
 More info
Office space in Aarhus C, Aarhus
Office space for rent in Aarhus C, Aarhus
Areal
Ca. 175 m2
Pris pr. md.
Ca. 15,500 DKK pr md
Område
Aarhus C, Aarhus
Type
Office space
Industrial property in Dublin 12, Dublin
 More info
Industrial property in Dublin 12, Dublin
Industrial property for rent in Dublin 12, Dublin
Areal
Ca. 970 m2
Pris pr. md.
Ca. 9,150 EUR pr md
Område
Dublin 12, Dublin
Type
Industrial property
Industrial property in Dun Laoghaire, Dublin (county)
 More info
Industrial property in Dun Laoghaire, Dublin (county)
Industrial property for sale in Dun Laoghaire, Dublin (county)
Areal
Ca. 330 m2
Pris
Ca. 495,000EUR
Område
Dun Laoghaire, Dublin (county)
Type
Industrial property
Industrial property in Dublin 17, Dublin
 More info
Industrial property in Dublin 17, Dublin
Industrial property for sale in Dublin 17, Dublin
Areal
Ca. 10 m2
Pris
Ca. 2,000,000EUR
Område
Dublin 17, Dublin
Type
Industrial property
Industrial property in Braintree - Essex, East of England
 More info
Industrial property in Braintree - Essex, East of England
Production for rent in Braintree - Essex, East of England
Areal
-
Pris pr. md.
Ca. 2,100 GBP pr md
Område
Braintree - Essex, East of England
Type
Industrial property
Industrial property in Almelo, Overijssel
 More info
Industrial property in Almelo, Overijssel
Productie te koop in Almelo, Overijssel
Areal
Ca. 1,455 m2
Pris
Ca. 1,775,000EUR
Område
Almelo, Overijssel
Type
Industrial property
Industrial property in Dublin 5, Dublin
 More info
Industrial property in Dublin 5, Dublin
Industrial property for rent in Dublin 5, Dublin
Areal
Ca. 100 m2
Pris pr. md.
Ca. 2,500 EUR pr md
Område
Dublin 5, Dublin
Type
Industrial property
Industrial property in Dublin 3, Dublin
 More info
Industrial property in Dublin 3, Dublin
Industrial property for rent in Dublin 3, Dublin
Areal
Ca. 385 m2
Pris pr. md.
Ca. 5,150 EUR pr md
Område
Dublin 3, Dublin
Type
Industrial property
Industrial property in Dublin 4, Dublin
 More info
Industrial property in Dublin 4, Dublin
Industrial property for rent in Dublin 4, Dublin
Areal
Ca. 10 m2
Pris pr. md.
Ca. 400 EUR pr md
Område
Dublin 4, Dublin
Type
Industrial property
Selected customers
30,000 customers use Companyspace.com
30,000 customers
285,000 companies in our database
2,400 rentals annually
Companyspace.com is used by thousands of landlords, property companies, commercial real estate agents, investors and business centres seeking greater visibility, more enquiries and lower vacancy rates.


