


Industrial properties in Europe
Companyspace.com today:
New today 2,965
Updated 24h 3,311
Notifications about new companyspaces2,183
Copenhagen +6
Stockholm +10
Amsterdam +3
Berlin +3
Vienna +6
Paris +5
Madrid +4
Dublin (county) +23
Warsaw +19
Greater London +14
Latest update 1 h ago
Active ads 369,199
19,091 industrial properties found
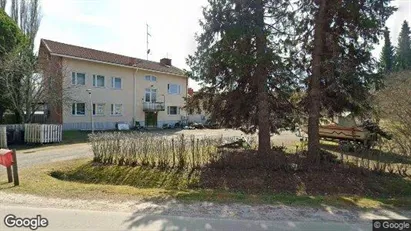
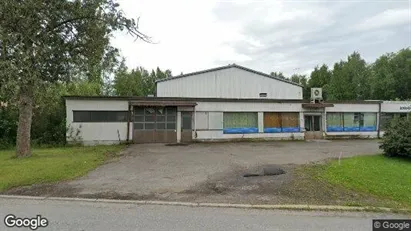
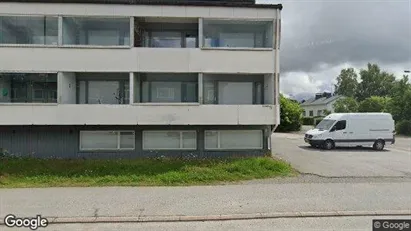
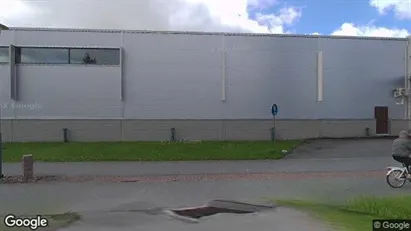
Industrial property in Pori, Satakunta
 More info
Industrial property in Pori, Satakunta
Industrial property for rent in Pori, Satakunta
Areal
Ca. 75 m2
Pris pr. md.
Ca. 500 EUR pr md
Område
Pori, Satakunta
Type
Industrial property
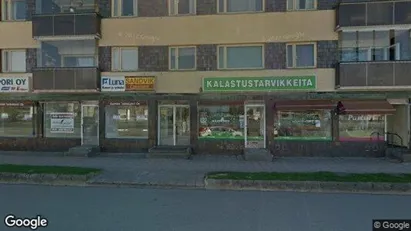
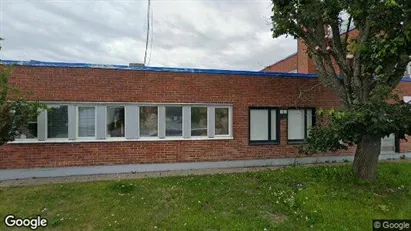
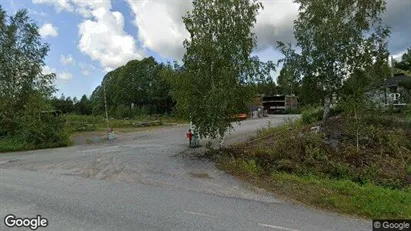
Industrial property in Pori, Satakunta
 More info
Industrial property in Pori, Satakunta
Industrial property for rent in Pori, Satakunta
Areal
Ca. 240 m2
Pris pr. md.
Ca. 1,800 EUR pr md
Område
Pori, Satakunta
Type
Industrial property
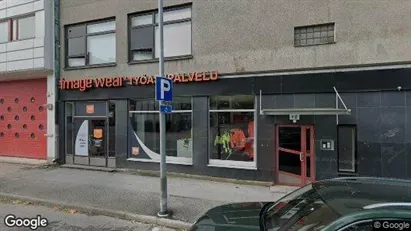
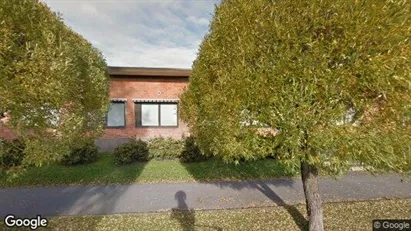
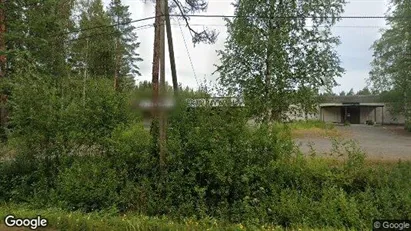
Industrial property in Pori, Satakunta
 More info
Industrial property in Pori, Satakunta
Industrial property for rent in Pori, Satakunta
Areal
Ca. 210 m2
Pris pr. md.
Ca. 1,250 EUR pr md
Område
Pori, Satakunta
Type
Industrial property
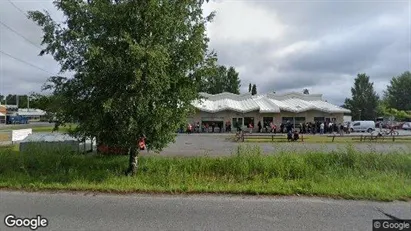
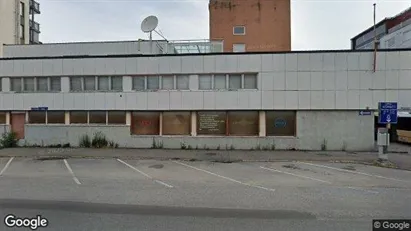
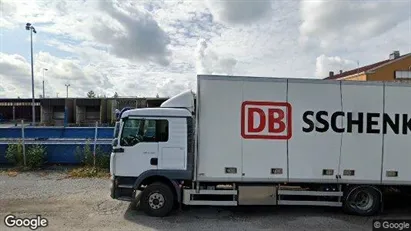
Industrial property in Pori, Satakunta
 More info
Industrial property in Pori, Satakunta
Industrial property for rent in Pori, Satakunta
Areal
Ca. 70 m2
Pris pr. md.
Ca. 500 EUR pr md
Område
Pori, Satakunta
Type
Industrial property
Industrial property in Pori, Satakunta
 More info
Industrial property in Pori, Satakunta
Industrial property for rent in Pori, Satakunta
Areal
Ca. 900 m2
Pris pr. md.
Ca. 4,900 EUR pr md
Område
Pori, Satakunta
Type
Industrial property
Industrial property in Pori, Satakunta
 More info
Industrial property in Pori, Satakunta
Industrial property for rent in Pori, Satakunta
Areal
Ca. 395 m2
Pris pr. md.
Ca. 3,150 EUR pr md
Område
Pori, Satakunta
Type
Industrial property
Industrial property in Pori, Satakunta
 More info
Industrial property in Pori, Satakunta
Industrial property for rent in Pori, Satakunta
Areal
Ca. 135 m2
Pris pr. md.
Ca. 800 EUR pr md
Område
Pori, Satakunta
Type
Industrial property
Industrial property in Pori, Satakunta
 More info
Industrial property in Pori, Satakunta
Industrial property for rent in Pori, Satakunta
Areal
Ca. 250 m2
Pris pr. md.
Ca. 2,250 EUR pr md
Område
Pori, Satakunta
Type
Industrial property
Industrial property in Pori, Satakunta
 More info
Industrial property in Pori, Satakunta
Industrial property for rent in Pori, Satakunta
Areal
Ca. 120 m2
Pris pr. md.
Ca. 500 EUR pr md
Område
Pori, Satakunta
Type
Industrial property
Industrial property in Pori, Satakunta
 More info
Industrial property in Pori, Satakunta
Industrial property for rent in Pori, Satakunta
Areal
Ca. 895 m2
Pris pr. md.
Ca. 2,700 EUR pr md
Område
Pori, Satakunta
Type
Industrial property
Industrial property in Pori, Satakunta
 More info
Industrial property in Pori, Satakunta
Industrial property for rent in Pori, Satakunta
Areal
Ca. 1,000 m2
Pris pr. md.
Ca. 3,500 EUR pr md
Område
Pori, Satakunta
Type
Industrial property
Industrial property in Pori, Satakunta
 More info
Industrial property in Pori, Satakunta
Industrial property for rent in Pori, Satakunta
Areal
Ca. 245 m2
Pris pr. md.
Ca. 1,200 EUR pr md
Område
Pori, Satakunta
Type
Industrial property
Industrial property in Ulvila, Satakunta
 More info
Industrial property in Ulvila, Satakunta
Industrial property for rent in Ulvila, Satakunta
Areal
Ca. 275 m2
Pris pr. md.
Ca. 2,750 EUR pr md
Område
Ulvila, Satakunta
Type
Industrial property
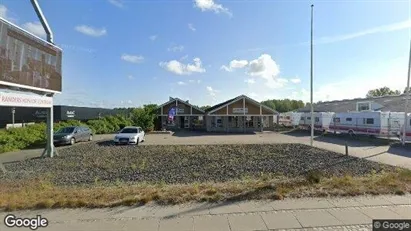
Warehouse in Randers SØ, Randers
 More info
Warehouse in Randers SØ, Randers
Warehouse for rent in Randers SØ, Randers
Areal
Ca. 190 m2
Pris pr. md.
Ca. 6,350 DKK pr md
Område
Randers SØ, Randers
Type
Warehouse
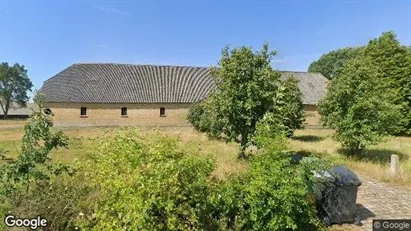
Warehouse in Skærbæk, Region of Southern Denmark
 More info
Warehouse in Skærbæk, Region of Southern Denmark
Warehouse for rent in Skærbæk, Region of Southern Denmark
Areal
Ca. 225 m2
Pris pr. md.
Ca. 4,650 DKK pr md
Område
Skærbæk, Region of Southern Denmark
Type
Warehouse
Warehouse in Assens, Funen
 More info
Warehouse in Assens, Funen
Warehouse for rent in Assens, Funen
Areal
Ca. 4,330 m2
Pris pr. md.
Ca. 54,150 DKK pr md
Område
Assens, Funen
Type
Warehouse
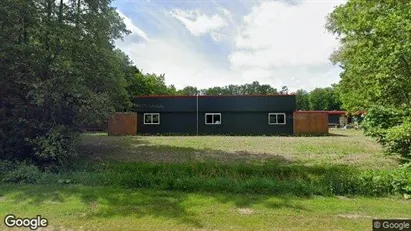
Industrial property in Noordoostpolder, Flevoland
 More info
Industrial property in Noordoostpolder, Flevoland
Industrial property for rent in Noordoostpolder, Flevoland
Areal
Ca. 160 m2
Pris pr. md.
Ca. 600 EUR pr md
Område
Noordoostpolder, Flevoland
Type
Industrial property
Office space in Egå, Aarhus
 More info
Office space in Egå, Aarhus
Office space for rent in Egå, Aarhus
Areal
Ca. 290 m2
Pris pr. md.
Ca. 13,050 DKK pr md
Område
Egå, Aarhus
Type
Office space
Selected customers
30,000 customers use Companyspace.com
30,000 customers
285,000 companies in our database
2,400 rentals annually
Companyspace.com is used by thousands of landlords, property companies, commercial real estate agents, investors and business centres seeking greater visibility, more enquiries and lower vacancy rates.


