


Industrial properties in Europe
Companyspace.com today:
New today 2,965
Updated 24h 3,039
Notifications about new companyspaces2,189
Copenhagen +6
Stockholm +10
Amsterdam +3
Berlin +3
Vienna +6
Paris +5
Madrid +4
Dublin (county) +23
Warsaw +19
Greater London +14
Latest update 2 h ago
Active ads 369,199
19,091 industrial properties found
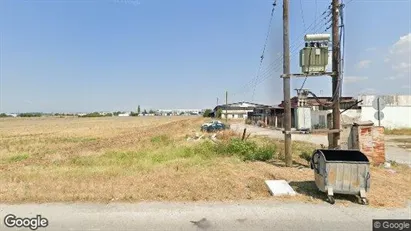
Industrial property in Thessaloniki, Central Macedonia
 More info
Industrial property in Thessaloniki, Central Macedonia
Industrial property for rent in Thessaloniki, Central Macedonia
Areal
Ca. 400 m2
Pris pr. md.
Ca. 1,200 EUR pr md
Område
Thessaloniki, Central Macedonia
Type
Industrial property
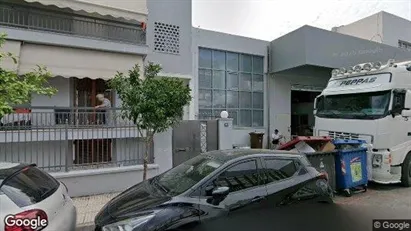
Industrial property in Peristeri, Attica
 More info
Industrial property in Peristeri, Attica
Industrial property for rent in Peristeri, Attica
Areal
Ca. 400 m2
Pris pr. md.
Ca. 3,500 EUR pr md
Område
Peristeri, Attica
Type
Industrial property
Industrial property in Luik, Luik (region)
 More info
Industrial property in Luik, Luik (region)
Industrial property for rent in Luik, Luik (region)
Areal
Ca. 5 m2
Pris pr. md.
Ca. 350 EUR pr md
Område
Luik, Luik (region)
Type
Industrial property
Industrial property in Luik, Luik (region)
 More info
Industrial property in Luik, Luik (region)
Industrial property for rent in Luik, Luik (region)
Areal
Ca. 5 m2
Pris pr. md.
Ca. 350 EUR pr md
Område
Luik, Luik (region)
Type
Industrial property
Industrial property in Peristeri, Attica
 More info
Industrial property in Peristeri, Attica
Industrial property for rent in Peristeri, Attica
Areal
Ca. 400 m2
Pris pr. md.
Ca. 7,000 EUR pr md
Område
Peristeri, Attica
Type
Industrial property
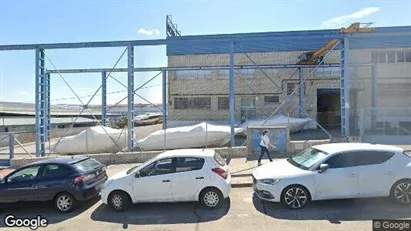
Industrial property in Peristeri, Attica
 More info
Industrial property in Peristeri, Attica
Industrial property for rent in Peristeri, Attica
Areal
Ca. 800 m2
Pris pr. md.
Ca. 10,500 EUR pr md
Område
Peristeri, Attica
Type
Industrial property
Warehouse in Ansager, Region of Southern Denmark
 More info
Warehouse in Ansager, Region of Southern Denmark
Warehouse for rent in Ansager, Region of Southern Denmark
Areal
Ca. 1,810 m2
Pris pr. md.
Ca. 39,350 DKK pr md
Område
Ansager, Region of Southern Denmark
Type
Warehouse
Industrial property in Alcobendas, Comunidad de Madrid
 More info
Industrial property in Alcobendas, Comunidad de Madrid
Industrial property for rent in Alcobendas, Comunidad de Madrid
Areal
Ca. 1,915 m2
Pris pr. md.
Ca. 13,400 EUR pr md
Område
Alcobendas, Comunidad de Madrid
Type
Industrial property
Industrial property in Stoke-on-Trent - Staffordshire, West Midlands
 More info
Industrial property in Stoke-on-Trent - Staffordshire, West Midlands
Production for rent in Stoke-on-Trent - Staffordshire, West Midlands
Areal
-
Pris pr. md.
Ca. 700 GBP pr md
Område
Stoke-on-Trent - Staffordshire, West Midlands
Type
Industrial property
Warehouse in Allerød, North Zealand
 More info
Warehouse in Allerød, North Zealand
Warehouse for rent in Allerød, North Zealand
Areal
Ca. 460 m2
Pris pr. md.
Ca. 23,000 DKK pr md
Område
Allerød, North Zealand
Type
Warehouse
Warehouse in Ikast, Central Jutland Region
 More info
Warehouse in Ikast, Central Jutland Region
Warehouse for rent in Ikast, Central Jutland Region
Areal
Ca. 475 m2
Pris pr. md.
Ca. 14,450 DKK pr md
Område
Ikast, Central Jutland Region
Type
Warehouse
Office space in Herning, Central Jutland Region
 More info
Office space in Herning, Central Jutland Region
Office space for rent in Herning, Central Jutland Region
Areal
Ca. 570 m2
Pris pr. md.
Ca. 34,300 DKK pr md
Område
Herning, Central Jutland Region
Type
Office space
Industrial property in Hulst, Zeeland
 More info
Industrial property in Hulst, Zeeland
Industrial property for rent in Hulst, Zeeland
Areal
-
Pris pr. md.
Ca. 2,850 EUR pr md
Område
Hulst, Zeeland
Type
Industrial property
Industrial property in Stoke-on-Trent - Staffordshire, West Midlands
 More info
Industrial property in Stoke-on-Trent - Staffordshire, West Midlands
Production for rent in Stoke-on-Trent - Staffordshire, West Midlands
Areal
-
Pris pr. md.
Ca. 18,350 GBP pr md
Område
Stoke-on-Trent - Staffordshire, West Midlands
Type
Industrial property
Industrial property in Øksnes, Nordland
 More info
Industrial property in Øksnes, Nordland
Industrial property for sale in Øksnes, Nordland
Areal
Ca. 990 m2
Pris
Ca. 875,000EUR
Område
Øksnes, Nordland
Type
Industrial property
Industrial property in Walsall - West Midlands, West Midlands
 More info
Industrial property in Walsall - West Midlands, West Midlands
Production for rent in Walsall - West Midlands, West Midlands
Areal
Ca. 5,100 m2
Pris pr. md.
Ca. 35,750 GBP pr md
Område
Walsall - West Midlands, West Midlands
Type
Industrial property
Industrial property in Chichester - West Sussex, South East
 More info
Industrial property in Chichester - West Sussex, South East
Production for sale in Chichester - West Sussex, South East
Areal
Ca. 1,355 m2
Pris
Ca. 491,000EUR
Område
Chichester - West Sussex, South East
Type
Industrial property
Industrial property in Hole, Buskerud
 More info
Industrial property in Hole, Buskerud
Industrial property for sale in Hole, Buskerud
Areal
Ca. 360 m2
Pris
Ca. 462,000EUR
Område
Hole, Buskerud
Type
Industrial property
Selected customers
30,000 customers use Companyspace.com
30,000 customers
285,000 companies in our database
2,400 rentals annually
Companyspace.com is used by thousands of landlords, property companies, commercial real estate agents, investors and business centres seeking greater visibility, more enquiries and lower vacancy rates.


