


Industrial properties in Europe
Companyspace.com today:
New today 2,965
Updated 24h 3,485
Notifications about new companyspaces2,183
Copenhagen +6
Stockholm +10
Amsterdam +3
Berlin +3
Vienna +6
Paris +5
Madrid +4
Dublin (county) +23
Warsaw +19
Greater London +14
Latest update 7 min ago
Active ads 369,199
19,091 industrial properties found
Warehouse in Hobro, Central Jutland Region
 More info
Warehouse in Hobro, Central Jutland Region
Warehouse for rent in Hobro, Central Jutland Region
Areal
Ca. 4,835 m2
Pris pr. md.
Ca. 37,500 DKK pr md
Område
Hobro, Central Jutland Region
Type
Warehouse
Industrial property in Delta, Central Macedonia
 More info
Industrial property in Delta, Central Macedonia
Industrial property for rent in Delta, Central Macedonia
Areal
Ca. 88,000 m2
Pris pr. md.
Ca. 3,450 EUR pr md
Område
Delta, Central Macedonia
Type
Industrial property
Office space in Brøndby, Greater Copenhagen
 More info
Office space in Brøndby, Greater Copenhagen
Office space for rent in Brøndby, Greater Copenhagen
Areal
Ca. 225 m2
Pris pr. md.
Ca. 13,950 DKK pr md
Område
Brøndby, Greater Copenhagen
Type
Office space
Warehouse in Glostrup, Greater Copenhagen
 More info
Warehouse in Glostrup, Greater Copenhagen
Warehouse for rent in Glostrup, Greater Copenhagen
Areal
Ca. 1,000 m2
Pris pr. md.
Ca. 70,850 DKK pr md
Område
Glostrup, Greater Copenhagen
Type
Warehouse
Warehouse in Glostrup, Greater Copenhagen
 More info
Warehouse in Glostrup, Greater Copenhagen
Warehouse for rent in Glostrup, Greater Copenhagen
Areal
Ca. 250 m2
Pris pr. md.
Ca. 17,700 DKK pr md
Område
Glostrup, Greater Copenhagen
Type
Warehouse
Warehouse in Glostrup, Greater Copenhagen
 More info
Warehouse in Glostrup, Greater Copenhagen
Warehouse for rent in Glostrup, Greater Copenhagen
Areal
Ca. 500 m2
Pris pr. md.
Ca. 35,400 DKK pr md
Område
Glostrup, Greater Copenhagen
Type
Warehouse
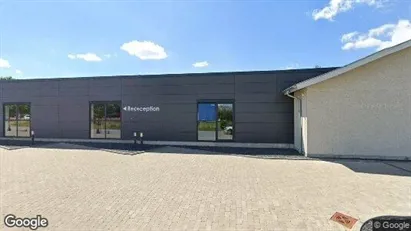
Office space in Aalborg Øst, Aalborg (region)
 More info
Office space in Aalborg Øst, Aalborg (region)
Office space for rent in Aalborg Øst, Aalborg (region)
Areal
Ca. 3,275 m2
Pris pr. md.
Ca. 140,850 DKK pr md
Område
Aalborg Øst, Aalborg (region)
Type
Office space
Office space in Ballerup, Greater Copenhagen
 More info
Office space in Ballerup, Greater Copenhagen
Office space for rent in Ballerup, Greater Copenhagen
Areal
Ca. 400 m2
Pris pr. md.
Ca. 18,100 DKK pr md
Område
Ballerup, Greater Copenhagen
Type
Office space
Warehouse in Ballerup, Greater Copenhagen
 More info
Warehouse in Ballerup, Greater Copenhagen
Warehouse for rent in Ballerup, Greater Copenhagen
Areal
Ca. 725 m2
Pris pr. md.
Ca. 23,000 DKK pr md
Område
Ballerup, Greater Copenhagen
Type
Warehouse
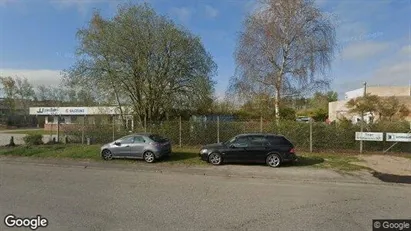
Warehouse in Varde, Region of Southern Denmark
 More info
Warehouse in Varde, Region of Southern Denmark
Warehouse for rent in Varde, Region of Southern Denmark
Areal
Ca. 760 m2
Pris pr. md.
Ca. 25,000 DKK pr md
Område
Varde, Region of Southern Denmark
Type
Warehouse
Warehouse in Sønderborg, Region of Southern Denmark
 More info
Warehouse in Sønderborg, Region of Southern Denmark
Warehouse for rent in Sønderborg, Region of Southern Denmark
Areal
Ca. 1,800 m2
Pris pr. md.
Ca. 37,500 DKK pr md
Område
Sønderborg, Region of Southern Denmark
Type
Warehouse
Warehouse in Assens, Funen
 More info
Warehouse in Assens, Funen
Warehouse for rent in Assens, Funen
Areal
Ca. 1,265 m2
Pris pr. md.
Ca. 15,550 DKK pr md
Område
Assens, Funen
Type
Warehouse
Warehouse in Assens, Funen
 More info
Warehouse in Assens, Funen
Warehouse for rent in Assens, Funen
Areal
Ca. 1,805 m2
Pris pr. md.
Ca. 22,550 DKK pr md
Område
Assens, Funen
Type
Warehouse
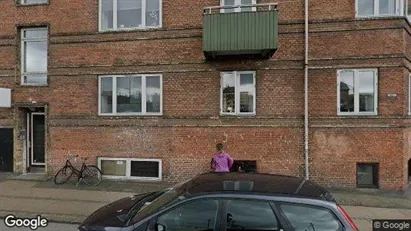
Warehouse in Valby, Copenhagen
 More info
Warehouse in Valby, Copenhagen
Warehouse for rent in Valby, Copenhagen
Areal
Ca. 225 m2
Pris pr. md.
Ca. 9,900 DKK pr md
Område
Valby, Copenhagen
Type
Warehouse
Warehouse in Randers SV, Central Jutland Region
 More info
Warehouse in Randers SV, Central Jutland Region
Warehouse for rent in Randers SV, Central Jutland Region
Areal
Ca. 310 m2
Pris pr. md.
Ca. 7,700 DKK pr md
Område
Randers SV, Central Jutland Region
Type
Warehouse
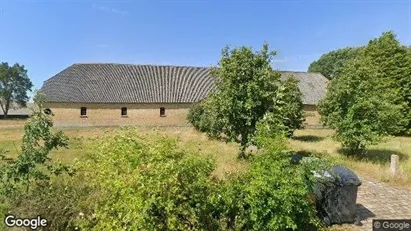
Warehouse in Havndal, Central Jutland Region
 More info
Warehouse in Havndal, Central Jutland Region
Warehouse for rent in Havndal, Central Jutland Region
Areal
Ca. 3,195 m2
Pris pr. md.
Ca. 50,000 DKK pr md
Område
Havndal, Central Jutland Region
Type
Warehouse
Warehouse in Hørning, Central Jutland Region
 More info
Warehouse in Hørning, Central Jutland Region
Warehouse for rent in Hørning, Central Jutland Region
Areal
Ca. 200 m2
Pris pr. md.
Ca. 7,500 DKK pr md
Område
Hørning, Central Jutland Region
Type
Warehouse
Warehouse in Horsens, Central Jutland Region
 More info
Warehouse in Horsens, Central Jutland Region
Warehouse for rent in Horsens, Central Jutland Region
Areal
Ca. 335 m2
Pris pr. md.
Ca. 10,500 DKK pr md
Område
Horsens, Central Jutland Region
Type
Warehouse
Selected customers
30,000 customers use Companyspace.com
30,000 customers
285,000 companies in our database
2,400 rentals annually
Companyspace.com is used by thousands of landlords, property companies, commercial real estate agents, investors and business centres seeking greater visibility, more enquiries and lower vacancy rates.


