


Industrial properties in Europe
Companyspace.com today:
New today 2,911
Updated 24h 3,925
Notifications about new companyspaces2,086
Copenhagen +4
Stockholm +1
Amsterdam +3
Berlin +3
Vienna +6
Paris +5
Madrid +4
Dublin (county) +23
Warsaw +19
Greater London +13
Latest update 23 min ago
Active ads 369,195
19,085 industrial properties found
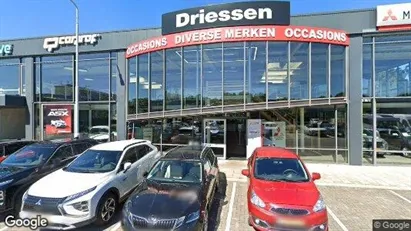
Industrial property in Eindhoven, North Brabant
 More info
Industrial property in Eindhoven, North Brabant
Industrial property for rent in Eindhoven, North Brabant
Areal
Ca. 1,995 m2
Pris pr. md.
Ca. 1,050 EUR pr md
Område
Eindhoven, North Brabant
Type
Industrial property
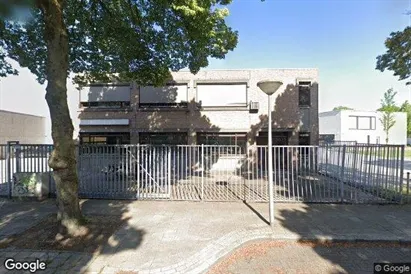
Industrial property in Eindhoven, North Brabant
 More info
Industrial property in Eindhoven, North Brabant
Industrial property for rent in Eindhoven, North Brabant
Areal
Ca. 610 m2
Pris pr. md.
Ca. 200 EUR pr md
Område
Eindhoven, North Brabant
Type
Industrial property
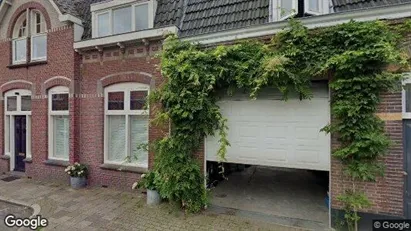
Industrial property in Eindhoven, North Brabant
 More info
Industrial property in Eindhoven, North Brabant
Industrial property for rent in Eindhoven, North Brabant
Areal
Ca. 150 m2
Pris pr. md.
Ca. 150 EUR pr md
Område
Eindhoven, North Brabant
Type
Industrial property
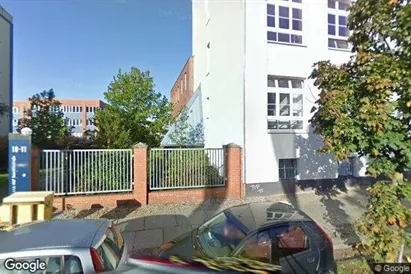
Office space in Turku, Varsinais-Suomi
 More info
Office space in Turku, Varsinais-Suomi
Office space for rent in Turku, Varsinais-Suomi
Areal
Ca. 750 m2
Pris pr. md.
Ca. 12,950 EUR pr md
Område
Turku, Varsinais-Suomi
Type
Office space
Office space in Vesilahti, Pirkanmaa
 More info
Office space in Vesilahti, Pirkanmaa
Office space for rent in Vesilahti, Pirkanmaa
Areal
Ca. 200 m2
Pris pr. md.
Ca. 800 EUR pr md
Område
Vesilahti, Pirkanmaa
Type
Office space
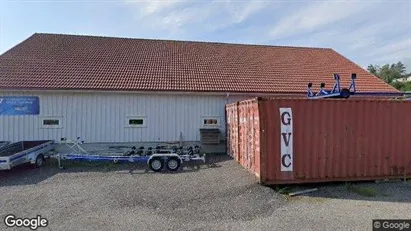
Warehouse in Aalestrup, Central Jutland Region
 More info
Warehouse in Aalestrup, Central Jutland Region
Warehouse for rent in Aalestrup, Central Jutland Region
Areal
Ca. 2,380 m2
Pris pr. md.
Ca. 49,600 DKK pr md
Område
Aalestrup, Central Jutland Region
Type
Warehouse
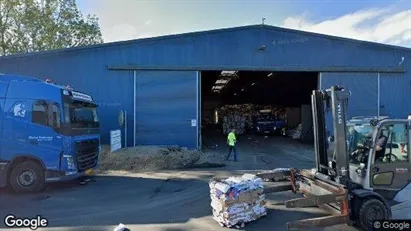
Warehouse in Brøndby, Greater Copenhagen
 More info
Warehouse in Brøndby, Greater Copenhagen
Warehouse for rent in Brøndby, Greater Copenhagen
Areal
Ca. 665 m2
Pris pr. md.
Ca. 39,000 DKK pr md
Område
Brøndby, Greater Copenhagen
Type
Warehouse
Industrial property in Edam-Volendam, North Holland
 More info
Industrial property in Edam-Volendam, North Holland
Productie te koop in Edam-Volendam, Noord-Holland
Areal
Ca. 85 m2
Pris
Ca. 235,000EUR
Område
Edam-Volendam, North Holland
Type
Industrial property
Industrial property in Berlin Mitte, Berlin
 More info
Industrial property in Berlin Mitte, Berlin
Industrial property for rent in Berlin Mitte, Berlin
Areal
Ca. 1,585 m2
Pris pr. md.
Not stated
Område
Berlin Mitte, Berlin
Type
Industrial property
Industrial property in Berlin Mitte, Berlin
 More info
Industrial property in Berlin Mitte, Berlin
Industrial property for rent in Berlin Mitte, Berlin
Areal
Ca. 805 m2
Pris pr. md.
Not stated
Område
Berlin Mitte, Berlin
Type
Industrial property
Industrial property in Berlin Mitte, Berlin
 More info
Industrial property in Berlin Mitte, Berlin
Industrial property for rent in Berlin Mitte, Berlin
Areal
Ca. 785 m2
Pris pr. md.
Not stated
Område
Berlin Mitte, Berlin
Type
Industrial property
Industrial property in Berlin Mitte, Berlin
 More info
Industrial property in Berlin Mitte, Berlin
Industrial property for rent in Berlin Mitte, Berlin
Areal
Ca. 805 m2
Pris pr. md.
Not stated
Område
Berlin Mitte, Berlin
Type
Industrial property
Industrial property in Bridgend - Mid Glamorgan, Cardiff (Region)
 More info
Industrial property in Bridgend - Mid Glamorgan, Cardiff (Region)
Production for rent in Bridgend - Mid Glamorgan, Cardiff (Region)
Areal
-
Pris pr. md.
Ca. 16,250 GBP pr md
Område
Bridgend - Mid Glamorgan, Cardiff (Region)
Type
Industrial property
Industrial property in Porsgrunn, Telemark
 More info
Industrial property in Porsgrunn, Telemark
Industrial property for sale in Porsgrunn, Telemark
Areal
Ca. 1,075 m2
Pris
Ca. 1,000EUR
Område
Porsgrunn, Telemark
Type
Industrial property
Industrial property in Herøy, Nordland
 More info
Industrial property in Herøy, Nordland
Industrial property for sale in Herøy, Nordland
Areal
Ca. 3,695 m2
Pris
Ca. 1,967,000EUR
Område
Herøy, Nordland
Type
Industrial property
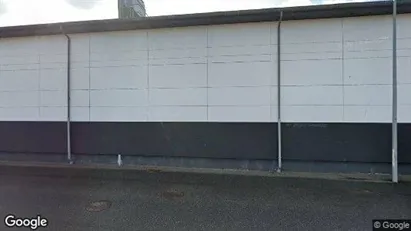
Warehouse in Horsens, Central Jutland Region
 More info
Warehouse in Horsens, Central Jutland Region
Warehouse for rent in Horsens, Central Jutland Region
Areal
Ca. 1,550 m2
Pris pr. md.
Ca. 25,850 DKK pr md
Område
Horsens, Central Jutland Region
Type
Warehouse
Warehouse in Esbjerg, Esbjerg (region)
 More info
Warehouse in Esbjerg, Esbjerg (region)
Warehouse for rent in Esbjerg, Esbjerg (region)
Areal
Ca. 375 m2
Pris pr. md.
Ca. 6,900 DKK pr md
Område
Esbjerg, Esbjerg (region)
Type
Warehouse
Shop in Aarhus C, Aarhus
More info
We monitor the market!
Shop in Aarhus C, Aarhus
Shop for rent in Aarhus C, Aarhus
Areal
Ca. 355 m2
Pris pr. md.
Ca. 17,700 DKK pr md
Område
Aarhus C, Aarhus
Type
Shop
Selected customers
30,000 customers use Companyspace.com
30,000 customers
285,000 companies in our database
2,400 rentals annually
Companyspace.com is used by thousands of landlords, property companies, commercial real estate agents, investors and business centres seeking greater visibility, more enquiries and lower vacancy rates.


