


Industrial properties in Switzerland
Companyspace.com today:
New today 874
Updated 24h 2,841
Notifications about new companyspaces6,715
Copenhagen +1
Stockholm +1
Berlin +115
Vienna +12
Roma (region) +1
Greater London +1
Latest update 3 h ago
Active ads 365,868
269 industrial properties found
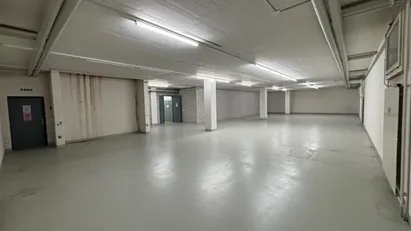
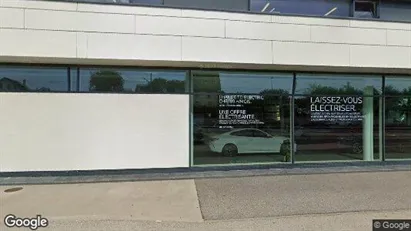
Warehouse in Winterthur, Zürich (Kantone)
 More info
Warehouse in Winterthur, Zürich (Kantone)
In der Im Hölderli 10 steht ab sofort ein ca. 1150 m² großes Lager zur Miete bereit. Diese vielseitig nutzbare Fläche eignet sich ideal für Unternehmen, die ...
Areal
Ca. 1,150 m2
Pris pr. md.
Ca. 11,250 EUR pr md
Område
Winterthur, Zürich (Kantone)
Type
Warehouse
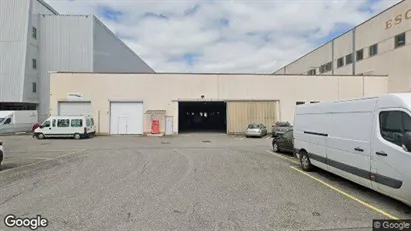
Industrial property in Muri, Aargau (Kantone)
 More info
Industrial property in Muri, Aargau (Kantone)
An der Bahnhofstrasse 27 in CH-5647 Oberrüti vermieten wir ein grosszügiges Gewerbe- und Lagerobjekt mit funktionaler Infrastruktur und flexiblen Nutzungsmög...
Areal
Ca. 3,500 m2
Pris pr. md.
Not stated
Område
Muri, Aargau (Kantone)
Type
Industrial property
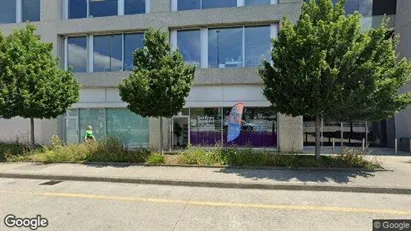
Industrial property in Meyrin, Geneva (Kantone)
 More info
Industrial property in Meyrin, Geneva (Kantone)
Industrial property for rent in Meyrin, Geneva (Kantone)
Areal
Ca. 135 m2
Pris pr. md.
Not stated
Område
Meyrin, Geneva (Kantone)
Type
Industrial property
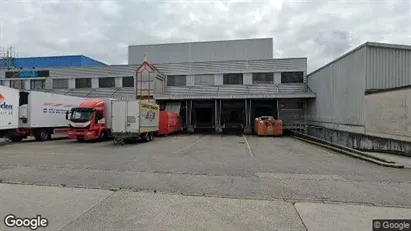
Industrial property in Satigny, Geneva (Kantone)
 More info
Industrial property in Satigny, Geneva (Kantone)
Industrial property for rent in Satigny, Geneva (Kantone)
Areal
Ca. 1,745 m2
Pris pr. md.
Not stated
Område
Satigny, Geneva (Kantone)
Type
Industrial property
Industrial property in Plan-les-Ouates, Geneva (Kantone)
 More info
Industrial property in Plan-les-Ouates, Geneva (Kantone)
Industrial property for rent in Plan-les-Ouates, Geneva (Kantone)
Areal
Ca. 2,365 m2
Pris pr. md.
Not stated
Område
Plan-les-Ouates, Geneva (Kantone)
Type
Industrial property
Industrial property in Satigny, Geneva (Kantone)
 More info
Industrial property in Satigny, Geneva (Kantone)
Industrial property for rent in Satigny, Geneva (Kantone)
Areal
Ca. 1,500 m2
Pris pr. md.
Not stated
Område
Satigny, Geneva (Kantone)
Type
Industrial property
Industrial property in Meyrin, Geneva (Kantone)
 More info
Industrial property in Meyrin, Geneva (Kantone)
Industrial property for rent in Meyrin, Geneva (Kantone)
Areal
Ca. 6,900 m2
Pris pr. md.
Not stated
Område
Meyrin, Geneva (Kantone)
Type
Industrial property
Industrial property in Carouge, Geneva (Kantone)
 More info
Industrial property in Carouge, Geneva (Kantone)
Industrial property for rent in Carouge, Geneva (Kantone)
Areal
Ca. 1,600 m2
Pris pr. md.
Not stated
Område
Carouge, Geneva (Kantone)
Type
Industrial property
Industrial property in Satigny, Geneva (Kantone)
 More info
Industrial property in Satigny, Geneva (Kantone)
Industrial property for rent in Satigny, Geneva (Kantone)
Areal
Ca. 410 m2
Pris pr. md.
Not stated
Område
Satigny, Geneva (Kantone)
Type
Industrial property
Industrial property in Lausanne, Waadt (Kantone)
 More info
Industrial property in Lausanne, Waadt (Kantone)
Industrial property for rent in Lausanne, Waadt (Kantone)
Areal
Ca. 2,365 m2
Pris pr. md.
Not stated
Område
Lausanne, Waadt (Kantone)
Type
Industrial property
Industrial property in Lausanne, Waadt (Kantone)
More info
Industrial property in Lausanne, Waadt (Kantone)
Industrial property for rent in Lausanne, Waadt (Kantone)
Areal
Ca. 1,270 m2
Pris pr. md.
Not stated
Område
Lausanne, Waadt (Kantone)
Type
Industrial property
Industrial property in Satigny, Geneva (Kantone)
More info
Industrial property in Satigny, Geneva (Kantone)
Industrial property for rent in Satigny, Geneva (Kantone)
Areal
Ca. 1,170 m2
Pris pr. md.
Not stated
Område
Satigny, Geneva (Kantone)
Type
Industrial property
Industrial property in Oberaargau, Bern (Kantone)
More info
Industrial property in Oberaargau, Bern (Kantone)
Industrial property for rent in Oberaargau, Bern (Kantone)
Areal
Ca. 65 m2
Pris pr. md.
Ca. 850 CHF pr md
Område
Oberaargau, Bern (Kantone)
Type
Industrial property
Industrial property in Martigny, Wallis (Kantone)
More info
Industrial property in Martigny, Wallis (Kantone)
Industrial property for sale in Martigny, Wallis (Kantone)
Areal
Ca. 750 m2
Pris
Ca. 1,111,000EUR
Område
Martigny, Wallis (Kantone)
Type
Industrial property
Industrial property in Bern-Mittelland, Bern (Kantone)
More info
Industrial property in Bern-Mittelland, Bern (Kantone)
Industrial property for rent in Bern-Mittelland, Bern (Kantone)
Areal
-
Pris pr. md.
Not stated
Område
Bern-Mittelland, Bern (Kantone)
Type
Industrial property
Industrial property in Zug, Zug (Kantone)
More info
Industrial property in Zug, Zug (Kantone)
Industrial property for rent in Zug, Zug (Kantone)
Areal
Ca. 20 m2
Pris pr. md.
Not stated
Område
Zug, Zug (Kantone)
Type
Industrial property
Industrial property in Hinwil, Zürich (Kantone)
More info
Industrial property in Hinwil, Zürich (Kantone)
Industrial property for rent in Hinwil, Zürich (Kantone)
Areal
Ca. 85 m2
Pris pr. md.
Ca. 1,300 CHF pr md
Område
Hinwil, Zürich (Kantone)
Type
Industrial property
Industrial property in Plan-les-Ouates, Geneva (Kantone)
More info
Industrial property in Plan-les-Ouates, Geneva (Kantone)
Industrial property for rent in Plan-les-Ouates, Geneva (Kantone)
Areal
Ca. 145 m2
Pris pr. md.
Ca. 3,550 CHF pr md
Område
Plan-les-Ouates, Geneva (Kantone)
Type
Industrial property
Selected customers
30,000 customers use Companyspace.com
30,000 customers
285,000 companies in our database
2,400 rentals annually
Companyspace.com is used by thousands of landlords, property companies, commercial real estate agents, investors and business centres seeking greater visibility, more enquiries and lower vacancy rates.


