Lediga industrilokaler i hela Schweiz
See all available industrilokaler in Schweiz below. If you are looking for industrilokal in Schweiz, you have come to the right place. We have most available industrilokaler in Schweiz in our database. Find industrilokal in Schweiz here. Enjoy.
Genève
Zurich
Aargau (Kantone)
Appenzell Ausserrhoden (Kantone)
Appenzell Innerrhoden (Kantone)
Basel-Landschaft (Kantone)
Basel-Stadt (Kantone)
Bern (Kantone)
Freiburg (Kantone)
Genève (region)
Glarus (Kantone)
Graubünden (Kantone)
Jura (Kantone)
Luzern (Kantone)
Neuenburg (Kantone)
Nidwalden (Kantone)
Obwalden (Kantone)
Sankt Gallen (Kantone)
Schaffhausen (Kantone)
Schwyz (Kantone)
Solothurn (Kantone)
Thurgau (Kantone)
Ticino (Kantone)
Uri (Kantone)
Waadt (Kantone)
Wallis (Kantone)
Zug (Kantone)
Zürich (Kantone)
263 industrilokaler hittades
-
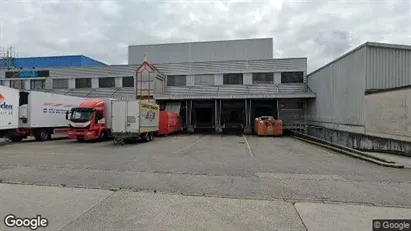
Ca. 1 270 m2 lager att hyra i Winterthur, Zürich (Kantone)
- Ca. 12 400 EUR kr per månad
- Ca. 100 EUR /m2/år - excl drift
-
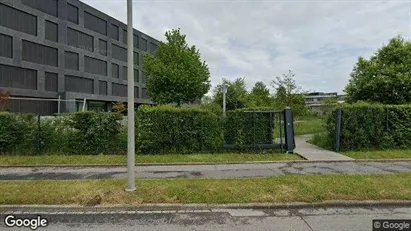
Ca. 2 840 m2 industrilokal att hyra i Meyrin, Genève (region)
- Ca. 3 000 CHF /m2/år - excl drift
-
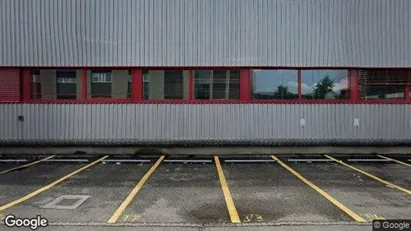
Ca. 1 500 m2 industrilokal att hyra i Satigny, Genève (region)
- Ca. 2 500 CHF /m2/år - excl drift
-
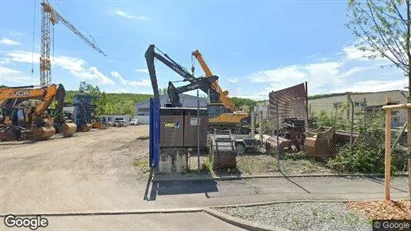
Ca. 2 100 m2 industrilokal att hyra i Meyrin, Genève (region)
- Ca. 3 100 CHF /m2/år - excl drift
-
Ca. 2 335 m2 industrilokal att hyra i Meyrin, Genève (region)
- Ca. 3 100 CHF /m2/år - excl drift
-
Ca. 410 m2 industrilokal att hyra i Satigny, Genève (region)
- Ca. 1 900 CHF /m2/år - excl drift
-
Ca. 2 365 m2 industrilokal att hyra i Lausanne, Waadt (Kantone)
- Ca. 2 300 CHF /m2/år - excl drift
-
Ca. 1 065 m2 industrilokal att hyra i Plan-les-Ouates, Genève (region)
- Ca. 3 600 CHF /m2/år - excl drift
-
Ca. 285 m2 industrilokal att hyra i Wil, Sankt Gallen (Kantone)
- Ca. 3 350 CHF kr per månad
- Ca. 150 CHF /m2/år - excl drift
-
Ca. 5 m2 industrilokal att hyra i Basel-Stadt, Basel-Stadt (Kantone)
- Ca. 2 000 CHF kr per månad
- Ca. 8 000 CHF /m2/år - excl drift
-
Ca. 100 m2 industrilokal att hyra i Pruntrut, Jura (Kantone)
- Ca. 1 000 CHF kr per månad
- Ca. 100 CHF /m2/år - excl drift
-
Ca. 100 m2 industrilokal att hyra i Neuenburg, Neuenburg (Kantone)
- Ca. 1 450 CHF kr per månad
- Ca. 150 CHF /m2/år - excl drift
-
Ca. 270 m2 industrilokal att hyra i Entlebuch, Luzern (Kantone)
- Ca. 150 CHF /m2/år - excl drift
-
Ca. 105 m2 industrilokal att hyra i Rheinfelden, Aargau (Kantone)
- Ca. 1 400 CHF kr per månad
- Ca. 150 CHF /m2/år - excl drift
-
Ca. 5 m2 industrilokal att hyra i Rorschach, Sankt Gallen (Kantone)
- Ca. 1 250 CHF kr per månad
- Ca. 7 550 CHF /m2/år - excl drift
-
Ca. 5 m2 industrilokal att hyra i Visp, Wallis (Kantone)
- Ca. 1 300 CHF kr per månad
- Ca. 3 900 CHF /m2/år - excl drift
Vanliga frågor
Statistik över utvecklingen av lediga industrilokaler i Schweiz under den senaste månaden
Se även samlad statistik över alla lediga industrilokaler över tid, samlad statistik över nya industrilokaler över tid, samlad statistik över uthyrda industrilokaler över tid.
| Datum | Alla industrilokaler att hyra | ||
|---|---|---|---|
| 10. februari 2026 | 267 | 4 | 3 |
| 9. februari 2026 | 266 | 5 | 0 |
| 8. februari 2026 | 261 | 1 | 11 |
| 7. februari 2026 | 271 | 82 | 82 |
| 6. februari 2026 | 271 | 48 | 0 |
| 5. februari 2026 | 223 | 4 | 0 |
| 4. februari 2026 | 219 | 7 | 5 |
| 3. februari 2026 | 217 | 0 | 0 |
| 2. februari 2026 | 217 | 1 | 6 |
| 1. februari 2026 | 222 | 4 | 0 |
| 31. januari 2026 | 218 | 1 | 6 |
| 30. januari 2026 | 223 | 6 | 2 |
| 29. januari 2026 | 219 | 1 | 0 |
| 28. januari 2026 | 218 | 0 | 6 |
| 27. januari 2026 | 224 | 0 | 1 |
| 26. januari 2026 | 225 | 0 | 1 |
| 25. januari 2026 | 226 | 4 | 0 |
| 24. januari 2026 | 222 | 0 | 0 |
| 23. januari 2026 | 222 | 5 | 0 |
| 22. januari 2026 | 217 | 0 | 6 |
| 21. januari 2026 | 223 | 0 | 0 |
| 20. januari 2026 | 223 | 2 | 4 |
| 19. januari 2026 | 225 | 2 | 0 |
| 18. januari 2026 | 223 | 4 | 3 |
| 17. januari 2026 | 222 | 0 | 0 |
| 16. januari 2026 | 222 | 6 | 8 |
| 15. januari 2026 | 224 | 2 | 0 |
| 14. januari 2026 | 222 | 6 | 4 |
| 13. januari 2026 | 220 | 1 | 7 |
| 12. januari 2026 | 226 | 0 | 0 |
| 11. januari 2026 | 226 | 1 | 0 |
Statistik över lediga industrilokaler i Schweiz
Se också samlad statistik över alla lediga industrilokaler över tid, samlad statisik över nya industrilokaler över tid, samlad statistik över uthyrda industrilokaler över tid
| Industrilokaler | |
|---|---|
| Antal lediga lokaler | 263 |
| Antal nya lokaler sedan igår | 4 |
| Antal uthyrda lokaler sedan igår | 3 |
| Lediga m2 totalt | 48 257 |
| Genomsnittligt pris per m2 per år utan drift | 36 280 |
| Högsta m2-pris | 4 444 444 |
| Lägsta m2-pris | 5,56 |


