


Industrial properties in The Netherlands
Companyspace.com today:
New today 399
Updated 24h 1,031
Notifications about new companyspaces41
Copenhagen +5
Amsterdam +1
Berlin +3
Brussels +2
Vienna +4
Dublin (county) +19
Warsaw +12
Roma (region) +1
Latest update 18 min ago
Active ads 364,391
932 industrial properties found
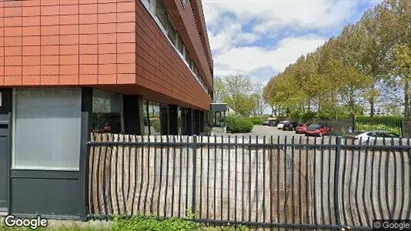
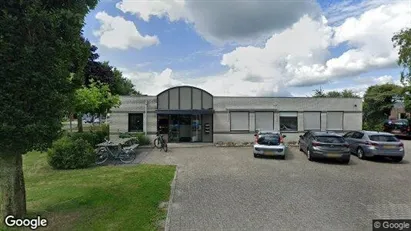
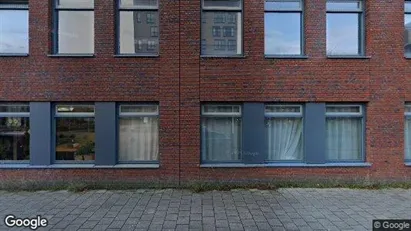
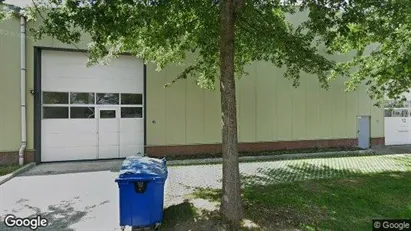
Industrial property in Stichtse Vecht, Province of Utrecht
 More info
Industrial property in Stichtse Vecht, Province of Utrecht
Bespaar op energiekosten: A+++ Bedrijfsunit te huur in Breukelen!
[xxxxx]
Body: Ondernemers opgelet! Op de Merwedeweg 4A7 hebben wij een splinternieuwe ...
Areal
Ca. 205 m2
Pris pr. md.
Ca. 2,400 EUR per month
Område
Stichtse Vecht, Province of Utrecht
Type
Industrial property
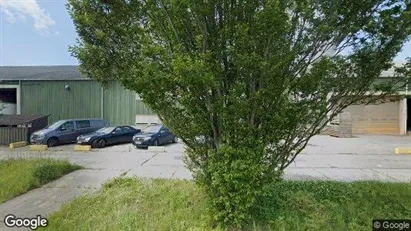
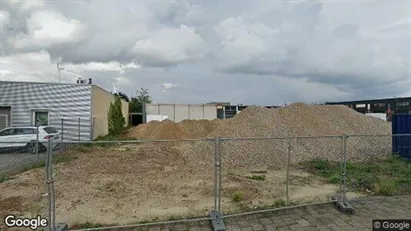
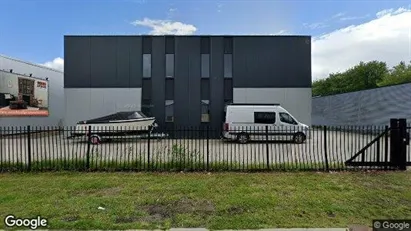
Industrial property in Putten, Gelderland
 More info
Industrial property in Putten, Gelderland
Industrial property for rent in Putten, Gelderland
Areal
Ca. 480 m2
Pris pr. md.
Not stated
Område
Putten, Gelderland
Type
Industrial property
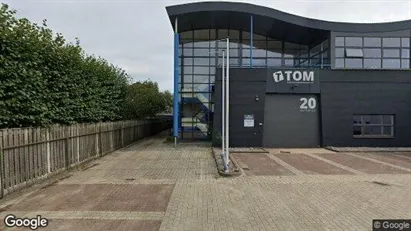
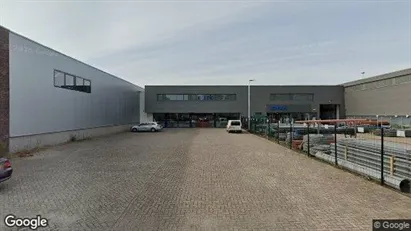
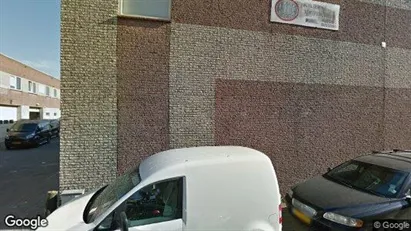
Industrial property in Sluis, Zeeland
 More info
Industrial property in Sluis, Zeeland
Industrial property for rent in Sluis, Zeeland
Areal
Ca. 8,000 m2
Pris pr. md.
Not stated
Område
Sluis, Zeeland
Type
Industrial property
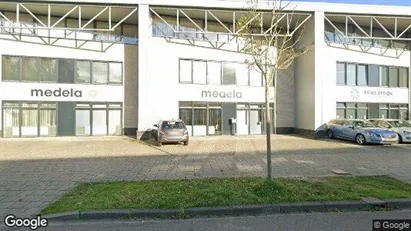
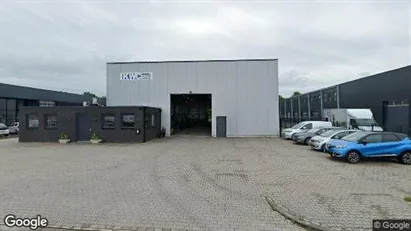
Industrial property in Amsterdam-Zuidoost, Amsterdam
 More info
Industrial property in Amsterdam-Zuidoost, Amsterdam
Beverage wholesale company
Areal
Ca. 100 m2
Pris pr. md.
Not stated
Område
Amsterdam-Zuidoost, Amsterdam
Type
Industrial property
Industrial property in Enschede, Overijssel
 More info
Industrial property in Enschede, Overijssel
Productie te koop in Enschede, Overijssel
Areal
Ca. 160 m2
Pris
Ca. 275,000EUR
Område
Enschede, Overijssel
Type
Industrial property
Industrial property in Hoogeveen, Drenthe
 More info
Industrial property in Hoogeveen, Drenthe
Industrial property for rent in Hoogeveen, Drenthe
Areal
-
Pris pr. md.
Ca. 1,750 EUR per month
Område
Hoogeveen, Drenthe
Type
Industrial property
Industrial property in Den Bosch, North Brabant
 More info
Industrial property in Den Bosch, North Brabant
Industrial property for rent in Den Bosch, North Brabant
Areal
Ca. 200 m2
Pris pr. md.
Ca. 2,000 EUR per month
Område
Den Bosch, North Brabant
Type
Industrial property
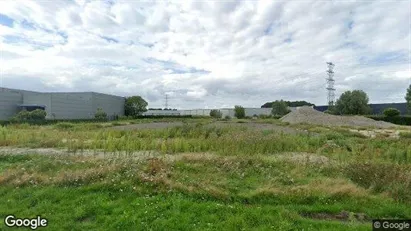
Industrial property in Bladel, North Brabant
 More info
Industrial property in Bladel, North Brabant
Industrial property for sale in Bladel, North Brabant
Areal
Ca. 2,875 m2
Pris
Ca. 2,050,000EUR
Område
Bladel, North Brabant
Type
Industrial property
Industrial property in Den Bosch, North Brabant
 More info
Industrial property in Den Bosch, North Brabant
Industrial property for rent in Den Bosch, North Brabant
Areal
Ca. 1,080 m2
Pris pr. md.
Ca. 8,750 EUR per month
Område
Den Bosch, North Brabant
Type
Industrial property
Industrial property in Heerhugowaard, North Holland
 More info
Industrial property in Heerhugowaard, North Holland
Industrial property for rent in Heerhugowaard, North Holland
Areal
Ca. 95 m2
Pris pr. md.
Ca. 1,450 EUR per month
Område
Heerhugowaard, North Holland
Type
Industrial property
Industrial property in Noordoostpolder, Flevoland
 More info
Industrial property in Noordoostpolder, Flevoland
Industrial property for rent in Noordoostpolder, Flevoland
Areal
Ca. 75 m2
Pris pr. md.
Ca. 1,100 EUR per month
Område
Noordoostpolder, Flevoland
Type
Industrial property
Industrial property in Tilburg, North Brabant
 More info
Industrial property in Tilburg, North Brabant
Industrial property for rent in Tilburg, North Brabant
Areal
Ca. 1,335 m2
Pris pr. md.
Ca. 8,750 EUR per month
Område
Tilburg, North Brabant
Type
Industrial property
Industrial property in Hoogeveen, Drenthe
 More info
Industrial property in Hoogeveen, Drenthe
Industrial property for rent in Hoogeveen, Drenthe
Areal
-
Pris pr. md.
Ca. 850 EUR per month
Område
Hoogeveen, Drenthe
Type
Industrial property
Industrial property in Hoogeveen, Drenthe
 More info
Industrial property in Hoogeveen, Drenthe
Industrial property for rent in Hoogeveen, Drenthe
Areal
-
Pris pr. md.
Ca. 800 EUR per month
Område
Hoogeveen, Drenthe
Type
Industrial property
Industrial property in Hoogeveen, Drenthe
 More info
Industrial property in Hoogeveen, Drenthe
Industrial property for rent in Hoogeveen, Drenthe
Areal
-
Pris pr. md.
Ca. 50 EUR per month
Område
Hoogeveen, Drenthe
Type
Industrial property
Industrial property in Hoogeveen, Drenthe
 More info
Industrial property in Hoogeveen, Drenthe
Industrial property for rent in Hoogeveen, Drenthe
Areal
-
Pris pr. md.
Ca. 850 EUR per month
Område
Hoogeveen, Drenthe
Type
Industrial property
Industrial property in Edam-Volendam, North Holland
 More info
Industrial property in Edam-Volendam, North Holland
Productie te koop in Edam-Volendam, Noord-Holland
Areal
Ca. 230 m2
Pris
Ca. 675,000EUR
Område
Edam-Volendam, North Holland
Type
Industrial property
Industrial property in Reusel-De Mierden, North Brabant
 More info
Industrial property in Reusel-De Mierden, North Brabant
Industrial property for rent in Reusel-De Mierden, North Brabant
Areal
Ca. 1,000 m2
Pris pr. md.
Ca. 3,750 EUR per month
Område
Reusel-De Mierden, North Brabant
Type
Industrial property
Selected customers
Selected customers
30,000 customers use Companyspace.com
30,000 customers
285,000 companies in our database
2,400 rentals annually
Companyspace.com is used by thousands of landlords, property companies, commercial real estate agents, investors and business centres seeking greater visibility, more enquiries and lower vacancy rates.


