


Industrial properties in The Netherlands
Companyspace.com today:
Updated 24h 1,008
Latest update 5 h ago
Active ads 365,896
933 industrial properties found
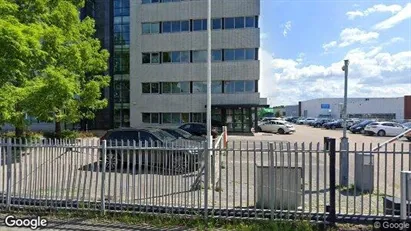
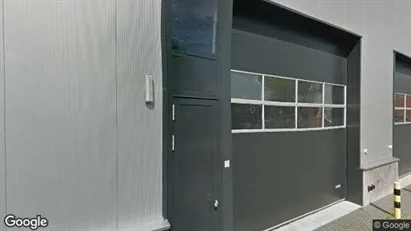
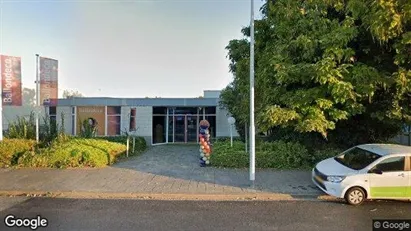
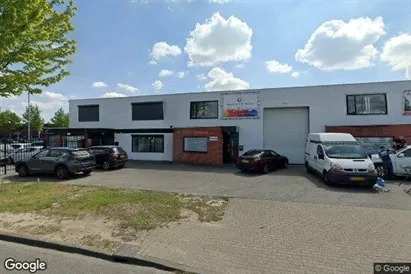
Industrial property in Eindhoven, North Brabant
 More info
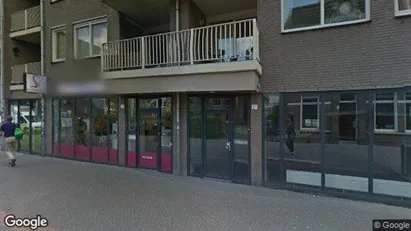
Industrial property in Eindhoven, North Brabant
Industrial property for sale in Eindhoven, North Brabant
Areal
Ca. 290 m2
Pris
Ca. 400,000EUR
Område
Eindhoven, North Brabant
Type
Industrial property
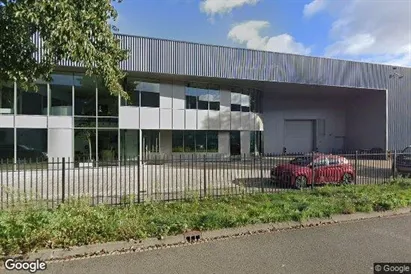
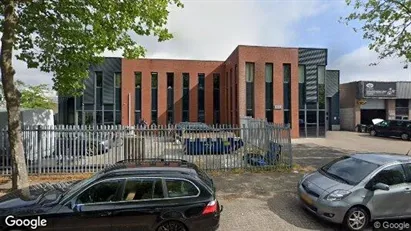
Industrial property in Eindhoven, North Brabant
 More info
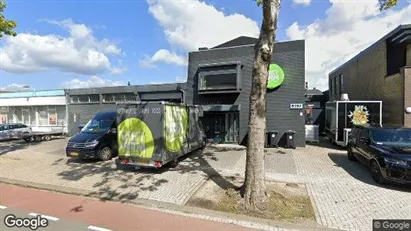
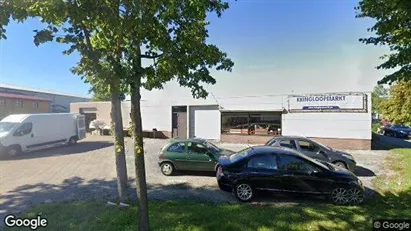
Industrial property in Eindhoven, North Brabant
Industrial property for rent in Eindhoven, North Brabant
Areal
Ca. 3,265 m2
Pris pr. md.
Ca. 2,050 EUR pr md
Område
Eindhoven, North Brabant
Type
Industrial property
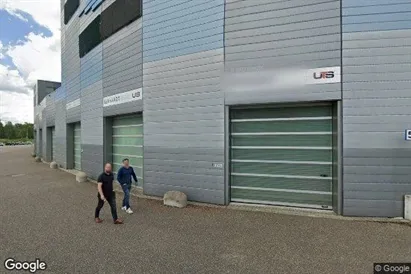
Industrial property in Eindhoven, North Brabant
 More info
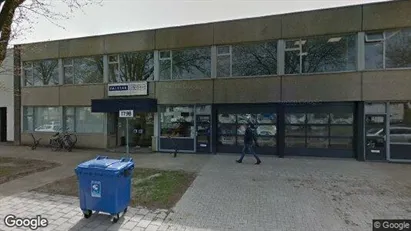
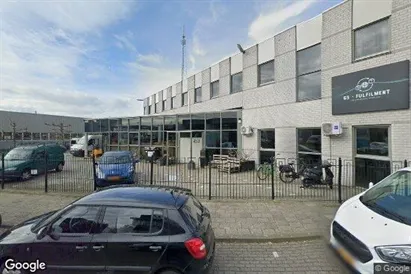
Industrial property in Eindhoven, North Brabant
Industrial property for rent in Eindhoven, North Brabant
Areal
Ca. 85 m2
Pris pr. md.
Ca. 150 EUR pr md
Område
Eindhoven, North Brabant
Type
Industrial property
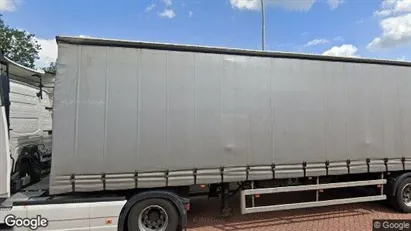
Industrial property in Eindhoven, North Brabant
 More info
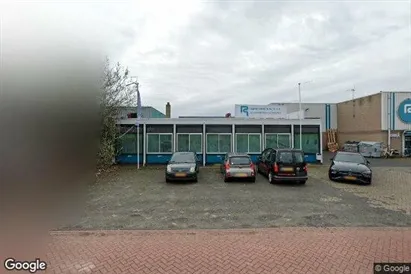
Industrial property in Eindhoven, North Brabant
Industrial property for rent in Eindhoven, North Brabant
Areal
Ca. 1,700 m2
Pris pr. md.
Ca. 450 EUR pr md
Område
Eindhoven, North Brabant
Type
Industrial property
Industrial property in Eindhoven, North Brabant
 More info
Industrial property in Eindhoven, North Brabant
Industrial property for rent in Eindhoven, North Brabant
Areal
Ca. 110 m2
Pris pr. md.
Ca. 100 EUR pr md
Område
Eindhoven, North Brabant
Type
Industrial property
Industrial property in Eindhoven, North Brabant
 More info
Industrial property in Eindhoven, North Brabant
Industrial property for sale in Eindhoven, North Brabant
Areal
Ca. 1,350 m2
Pris
Ca. 1,650,000EUR
Område
Eindhoven, North Brabant
Type
Industrial property
Industrial property in Eindhoven, North Brabant
 More info
Industrial property in Eindhoven, North Brabant
Industrial property for rent in Eindhoven, North Brabant
Areal
Ca. 3,185 m2
Pris pr. md.
Ca. 1,600 EUR pr md
Område
Eindhoven, North Brabant
Type
Industrial property
Industrial property in Noordoostpolder, Flevoland
 More info
Industrial property in Noordoostpolder, Flevoland
Industrial property for rent in Noordoostpolder, Flevoland
Areal
Ca. 1,590 m2
Pris pr. md.
Ca. 3,500 EUR pr md
Område
Noordoostpolder, Flevoland
Type
Industrial property
Industrial property in Eindhoven, North Brabant
 More info
Industrial property in Eindhoven, North Brabant
Industrial property for rent in Eindhoven, North Brabant
Areal
Ca. 2,150 m2
Pris pr. md.
Ca. 1,100 EUR pr md
Område
Eindhoven, North Brabant
Type
Industrial property
Industrial property in Eindhoven, North Brabant
 More info
Industrial property in Eindhoven, North Brabant
Industrial property for rent in Eindhoven, North Brabant
Areal
Ca. 230 m2
Pris pr. md.
Ca. 200 EUR pr md
Område
Eindhoven, North Brabant
Type
Industrial property
Industrial property in Eindhoven, North Brabant
 More info
Industrial property in Eindhoven, North Brabant
Industrial property for sale in Eindhoven, North Brabant
Areal
Ca. 125 m2
Pris
Ca. 239,000EUR
Område
Eindhoven, North Brabant
Type
Industrial property
Industrial property in Eindhoven, North Brabant
 More info
Industrial property in Eindhoven, North Brabant
Industrial property for rent in Eindhoven, North Brabant
Areal
Ca. 3,205 m2
Pris pr. md.
Ca. 1,250 EUR pr md
Område
Eindhoven, North Brabant
Type
Industrial property
Industrial property in Eindhoven, North Brabant
 More info
Industrial property in Eindhoven, North Brabant
Industrial property for rent in Eindhoven, North Brabant
Areal
Ca. 320 m2
Pris pr. md.
Ca. 400 EUR pr md
Område
Eindhoven, North Brabant
Type
Industrial property
Industrial property in Eindhoven, North Brabant
 More info
Industrial property in Eindhoven, North Brabant
Industrial property for rent in Eindhoven, North Brabant
Areal
Ca. 6,400 m2
Pris pr. md.
Ca. 3,250 EUR pr md
Område
Eindhoven, North Brabant
Type
Industrial property
Industrial property in Eindhoven, North Brabant
 More info
Industrial property in Eindhoven, North Brabant
Industrial property for rent in Eindhoven, North Brabant
Areal
Ca. 170 m2
Pris pr. md.
Ca. 100 EUR pr md
Område
Eindhoven, North Brabant
Type
Industrial property
Industrial property in Eindhoven, North Brabant
 More info
Industrial property in Eindhoven, North Brabant
Industrial property for rent in Eindhoven, North Brabant
Areal
Ca. 1,100 m2
Pris pr. md.
Ca. 400 EUR pr md
Område
Eindhoven, North Brabant
Type
Industrial property
Industrial property in Eindhoven, North Brabant
 More info
Industrial property in Eindhoven, North Brabant
Industrial property for rent in Eindhoven, North Brabant
Areal
Ca. 360 m2
Pris pr. md.
Ca. 150 EUR pr md
Område
Eindhoven, North Brabant
Type
Industrial property
Industrial property in Eindhoven, North Brabant
 More info
Industrial property in Eindhoven, North Brabant
Industrial property for rent in Eindhoven, North Brabant
Areal
Ca. 750 m2
Pris pr. md.
Ca. 400 EUR pr md
Område
Eindhoven, North Brabant
Type
Industrial property
Selected customers
30,000 customers use Companyspace.com
30,000 customers
285,000 companies in our database
2,400 rentals annually
Companyspace.com is used by thousands of landlords, property companies, commercial real estate agents, investors and business centres seeking greater visibility, more enquiries and lower vacancy rates.


