


Industrial propertiesin North Brabant
See all available industrial properties in North Brabant below. If you are looking for industrial property in North Brabant, you have come to the right place. We have most available industrial properties in North Brabant in our database. Find industrial property in North Brabant here. Enjoy.
Companyspace.com today:
New today 732
Updated 24h 1,766
Notifications about new companyspaces74
Copenhagen +1
Stockholm +1
Amsterdam +3
Berlin +3
Brussels +6
Vienna +16
Paris +1
Madrid +12
Dublin (county) +11
Warsaw +7
Roma (region) +3
Lisbon +1
Latest update 9 min ago
Active ads 364,816
140 industrial properties found
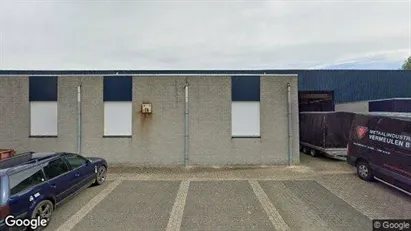
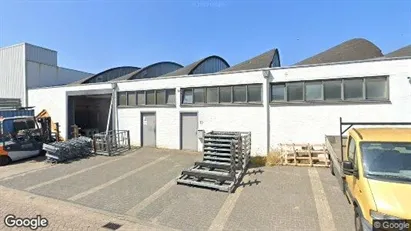
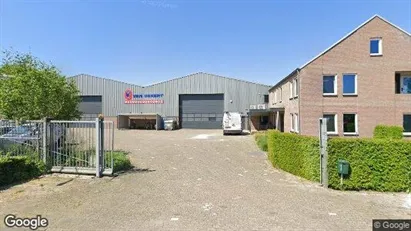
Industrial property in Bladel, North Brabant
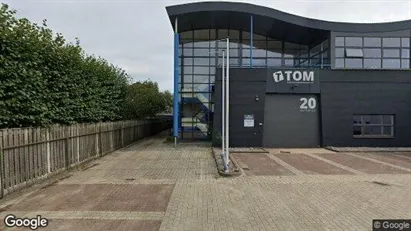 More info
Industrial property in Bladel, North Brabant
Industrial property for sale in Bladel, North Brabant
Areal
Ca. 2,875 m2
Pris
Ca. 2,050,000EUR
Område
Bladel, North Brabant
Type
Industrial property
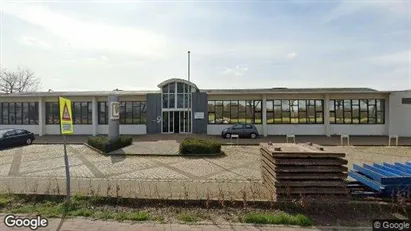
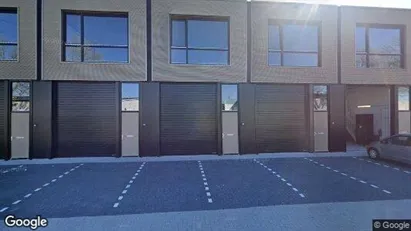
Industrial property in Den Bosch, North Brabant
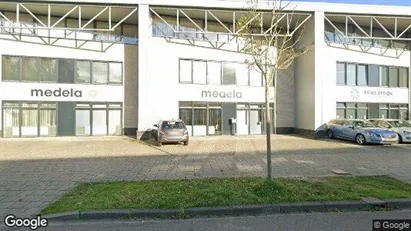 More info
Industrial property in Den Bosch, North Brabant
Industrial property for rent in Den Bosch, North Brabant
Areal
Ca. 1,080 m2
Pris pr. md.
Ca. 8,750 EUR per month
Område
Den Bosch, North Brabant
Type
Industrial property
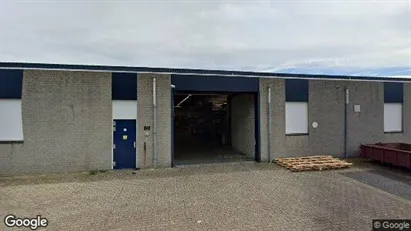
Industrial property in Den Bosch, North Brabant
 More info
Industrial property in Den Bosch, North Brabant
Industrial property for rent in Den Bosch, North Brabant
Areal
Ca. 200 m2
Pris pr. md.
Ca. 2,000 EUR per month
Område
Den Bosch, North Brabant
Type
Industrial property
Industrial property in Tilburg, North Brabant
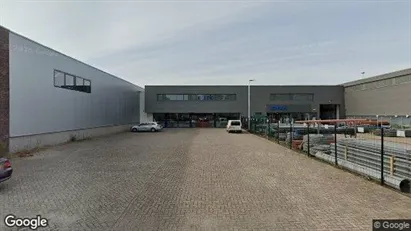 More info
Industrial property in Tilburg, North Brabant
Industrial property for rent in Tilburg, North Brabant
Areal
Ca. 1,335 m2
Pris pr. md.
Ca. 8,750 EUR per month
Område
Tilburg, North Brabant
Type
Industrial property
Industrial property in Bladel, North Brabant
 More info
Industrial property in Bladel, North Brabant
Industrial property for rent in Bladel, North Brabant
Areal
Ca. 130 m2
Pris pr. md.
Ca. 1,150 EUR per month
Område
Bladel, North Brabant
Type
Industrial property
Industrial property in Bladel, North Brabant
 More info
Industrial property in Bladel, North Brabant
Industrial property for rent in Bladel, North Brabant
Areal
Ca. 180 m2
Pris pr. md.
Ca. 600 EUR per month
Område
Bladel, North Brabant
Type
Industrial property
Industrial property in Bladel, North Brabant
 More info
Industrial property in Bladel, North Brabant
Industrial property for rent in Bladel, North Brabant
Areal
Ca. 1,200 m2
Pris pr. md.
Ca. 6,600 EUR per month
Område
Bladel, North Brabant
Type
Industrial property
Industrial property in Bladel, North Brabant
 More info
Industrial property in Bladel, North Brabant
Industrial property for rent in Bladel, North Brabant
Areal
Ca. 130 m2
Pris pr. md.
Ca. 1,150 EUR per month
Område
Bladel, North Brabant
Type
Industrial property
Industrial property in Bladel, North Brabant
 More info
Industrial property in Bladel, North Brabant
Industrial property for rent in Bladel, North Brabant
Areal
Ca. 130 m2
Pris pr. md.
Ca. 1,350 EUR per month
Område
Bladel, North Brabant
Type
Industrial property
Industrial property in Reusel-De Mierden, North Brabant
 More info
Industrial property in Reusel-De Mierden, North Brabant
Industrial property for rent in Reusel-De Mierden, North Brabant
Areal
Ca. 1,000 m2
Pris pr. md.
Ca. 3,750 EUR per month
Område
Reusel-De Mierden, North Brabant
Type
Industrial property
Industrial property in Bladel, North Brabant
 More info
Industrial property in Bladel, North Brabant
Industrial property for rent in Bladel, North Brabant
Areal
Ca. 890 m2
Pris pr. md.
Ca. 3,750 EUR per month
Område
Bladel, North Brabant
Type
Industrial property
Industrial property in Reusel-De Mierden, North Brabant
 More info
Industrial property in Reusel-De Mierden, North Brabant
Industrial property for rent in Reusel-De Mierden, North Brabant
Areal
Ca. 310 m2
Pris pr. md.
Ca. 1,050 EUR per month
Område
Reusel-De Mierden, North Brabant
Type
Industrial property
Industrial property in Bladel, North Brabant
 More info
Industrial property in Bladel, North Brabant
Industrial property for rent in Bladel, North Brabant
Areal
Ca. 130 m2
Pris pr. md.
Ca. 1,150 EUR per month
Område
Bladel, North Brabant
Type
Industrial property
Industrial property in Bladel, North Brabant
 More info
Industrial property in Bladel, North Brabant
Industrial property for rent in Bladel, North Brabant
Areal
Ca. 970 m2
Pris pr. md.
Ca. 3,450 EUR per month
Område
Bladel, North Brabant
Type
Industrial property
Industrial property in Bladel, North Brabant
 More info
Industrial property in Bladel, North Brabant
Industrial property for rent in Bladel, North Brabant
Areal
Ca. 190 m2
Pris pr. md.
Ca. 1,250 EUR per month
Område
Bladel, North Brabant
Type
Industrial property
Industrial property in Bladel, North Brabant
 More info
Industrial property in Bladel, North Brabant
Industrial property for rent in Bladel, North Brabant
Areal
Ca. 490 m2
Pris pr. md.
Ca. 2,750 EUR per month
Område
Bladel, North Brabant
Type
Industrial property
Industrial property in Tilburg, North Brabant
 More info
Industrial property in Tilburg, North Brabant
Industrial property for rent in Tilburg, North Brabant
Areal
Ca. 2,050 m2
Pris pr. md.
Ca. 13,000 EUR per month
Område
Tilburg, North Brabant
Type
Industrial property
Industrial property in Helmond, North Brabant
 More info
Industrial property in Helmond, North Brabant
Industrial property for rent in Helmond, North Brabant
Areal
Ca. 75 m2
Pris pr. md.
Not stated
Område
Helmond, North Brabant
Type
Industrial property
Selected customers


