


Industrial properties in Europe
Companyspace.com today:
New today 2,899
Updated 24h 3,921
Notifications about new companyspaces1,937
Copenhagen +2
Stockholm +1
Amsterdam +3
Berlin +3
Vienna +6
Paris +5
Madrid +4
Dublin (county) +23
Warsaw +19
Greater London +13
Latest update 1 h ago
Active ads 369,114
19,081 industrial properties found
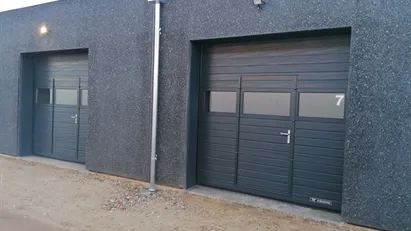
Warehouse in Ullerslev, Funen
 More info
Warehouse in Ullerslev, Funen
Warehouse for rent in Ullerslev, Funen
Areal
Ca. 1,000 m2
Pris pr. md.
Not stated
Område
Ullerslev, Funen
Type
Warehouse
Warehouse in Skævinge, North Zealand
 More info
Warehouse in Skævinge, North Zealand
Warehouse for rent in Skævinge, North Zealand
Areal
Ca. 100 m2
Pris pr. md.
Ca. 5,500 DKK pr md
Område
Skævinge, North Zealand
Type
Warehouse
Industrial property in Haninge, Stockholm County
 More info
Industrial property in Haninge, Stockholm County
Industrial property for rent in Haninge, Stockholm County
Areal
Ca. 100 m2
Pris pr. md.
Ca. 12,300 SEK pr md
Område
Haninge, Stockholm County
Type
Industrial property
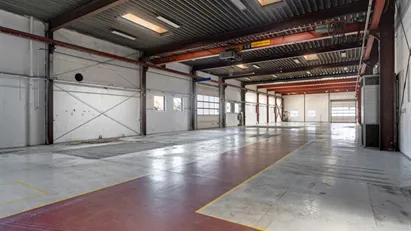
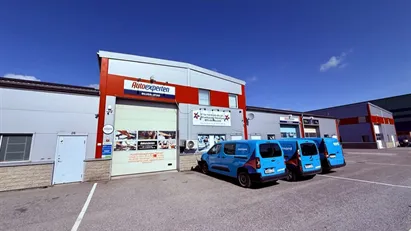
Industrial property in Agerbæk, Region of Southern Denmark
 More info
Industrial property in Agerbæk, Region of Southern Denmark
Industrial property for rent in Agerbæk, Region of Southern Denmark
Areal
500 - 10,300 m2
Pris pr. md.
Ca. 150,200 DKK pr md
Område
Agerbæk, Region of Southern Denmark
Type
Industrial property
Office space in Vesterbro, Copenhagen
 More info
Office space in Vesterbro, Copenhagen
Office space for rent in Vesterbro, Copenhagen
Areal
12 - 86 m2
Pris pr. md.
Ca. 6,000 DKK pr md
Område
Vesterbro, Copenhagen
Type
Office space
Office space in Aalborg, Aalborg (region)
 More info
Office space in Aalborg, Aalborg (region)
Office space for rent in Aalborg, Aalborg (region)
Areal
72 - 144 m2
Pris pr. md.
Not stated
Område
Aalborg, Aalborg (region)
Type
Office space
Office space in Stockholm City, Stockholm
 More info
Office space in Stockholm City, Stockholm
Office space for rent in Stockholm City, Stockholm
Areal
10 - 23 m2
Pris pr. md.
Not stated
Område
Stockholm City, Stockholm
Type
Office space
Office space in Sorø, Region Zealand
 More info
Office space in Sorø, Region Zealand
Office space for rent in Sorø, Region Zealand
Areal
Ca. 1,250 m2
Pris pr. md.
Ca. 49,500 DKK pr md
Område
Sorø, Region Zealand
Type
Office space
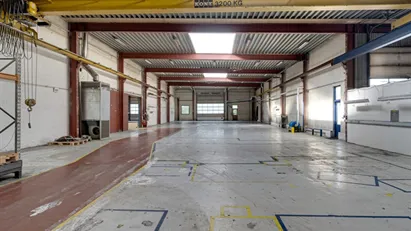
Warehouse in Ullerslev, Funen
 More info
Warehouse in Ullerslev, Funen
Warehouse for rent in Ullerslev, Funen
Areal
Ca. 2,000 m2
Pris pr. md.
Ca. 49,150 DKK pr md
Område
Ullerslev, Funen
Type
Warehouse
Warehouse in Kjellerup, Central Jutland Region
 More info
Warehouse in Kjellerup, Central Jutland Region
Warehouse for rent in Kjellerup, Central Jutland Region
Areal
23 - 45 m2
Pris pr. md.
Ca. 3,650 DKK pr md
Område
Kjellerup, Central Jutland Region
Type
Warehouse
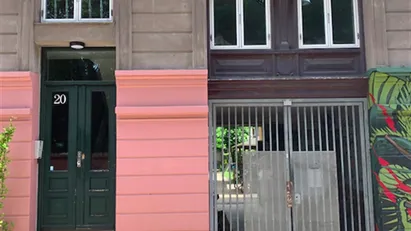
Office space in Nørrebro, Copenhagen
 More info
Office space in Nørrebro, Copenhagen
Office space for rent in Nørrebro, Copenhagen
Areal
Ca. 40 m2
Pris pr. md.
Ca. 7,000 DKK pr md
Område
Nørrebro, Copenhagen
Type
Office space
Industrial property in Haninge, Stockholm County
 More info
Industrial property in Haninge, Stockholm County
Industrial property for rent in Haninge, Stockholm County
Areal
Ca. 195 m2
Pris pr. md.
Ca. 21,500 SEK pr md
Område
Haninge, Stockholm County
Type
Industrial property
Industrial property in Haninge, Stockholm County
 More info
Industrial property in Haninge, Stockholm County
Industrial property for rent in Haninge, Stockholm County
Areal
Ca. 100 m2
Pris pr. md.
Ca. 12,000 SEK pr md
Område
Haninge, Stockholm County
Type
Industrial property
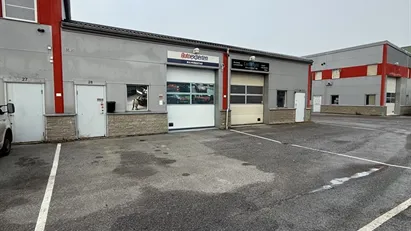
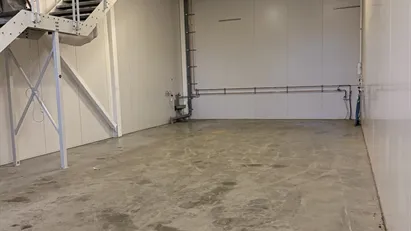
Industrial property in Odense SØ, Odense
 More info
Industrial property in Odense SØ, Odense
Industrial property for rent in Odense SØ, Odense
Areal
Ca. 275 m2
Pris pr. md.
Ca. 17,500 DKK pr md
Område
Odense SØ, Odense
Type
Industrial property
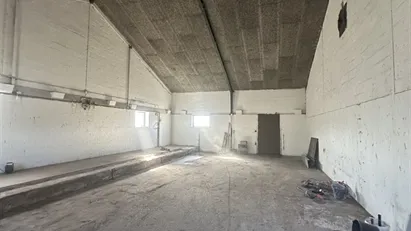
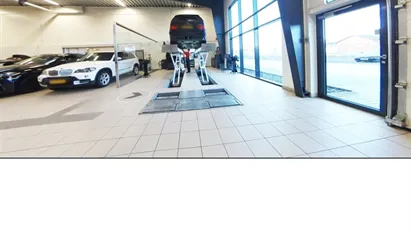
Industrial property in Ølgod, Region of Southern Denmark
 More info
Industrial property in Ølgod, Region of Southern Denmark
Industrial property for rent in Ølgod, Region of Southern Denmark
Areal
100 - 4,000 m2
Pris pr. md.
Ca. 8,350 DKK pr md
Område
Ølgod, Region of Southern Denmark
Type
Industrial property
Warehouse in Gistrup, Aalborg (region)
 More info
Warehouse in Gistrup, Aalborg (region)
Warehouse for rent in Gistrup, Aalborg (region)
Areal
Ca. 75 m2
Pris pr. md.
Not stated
Område
Gistrup, Aalborg (region)
Type
Warehouse
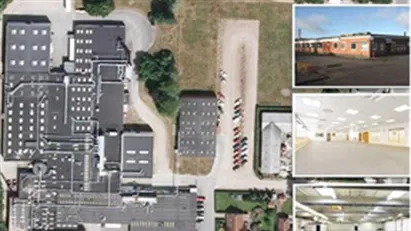
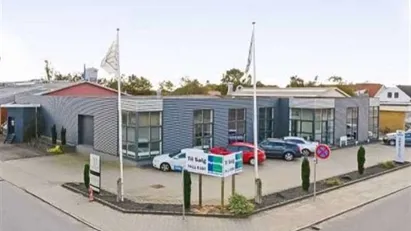
Industrial property in Randers NV, Randers
 More info
Industrial property in Randers NV, Randers
Industrial property for rent in Randers NV, Randers
Areal
20 - 7,000 m2
Pris pr. md.
Ca. 204,150 DKK pr md
Område
Randers NV, Randers
Type
Industrial property
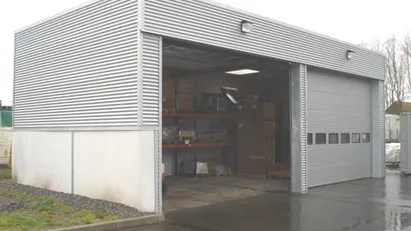
Industrial property in Perstorp, Skåne County
 More info
Industrial property in Perstorp, Skåne County
Industrial property for rent in Perstorp, Skåne County
Areal
Ca. 215 m2
Pris pr. md.
Ca. 6,900 SEK pr md
Område
Perstorp, Skåne County
Type
Industrial property
Selected customers
30,000 customers use Companyspace.com
30,000 customers
285,000 companies in our database
2,400 rentals annually
Companyspace.com is used by thousands of landlords, property companies, commercial real estate agents, investors and business centres seeking greater visibility, more enquiries and lower vacancy rates.


