


Industrial properties in Europe
Companyspace.com today:
New today 2,899
Updated 24h 3,921
Notifications about new companyspaces1,937
Copenhagen +2
Stockholm +1
Amsterdam +3
Berlin +3
Vienna +6
Paris +5
Madrid +4
Dublin (county) +23
Warsaw +19
Greater London +13
Latest update 1 h ago
Active ads 369,114
19,081 industrial properties found
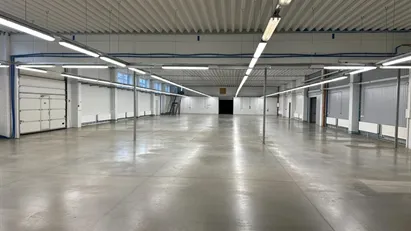
Industrial property in Osnabrück, Niedersachsen
More info
We monitor the market!
Industrial property in Osnabrück, Niedersachsen
Industrial property for rent in Osnabrück, Niedersachsen
Areal
Ca. 240 m2
Pris pr. md.
Ca. 50 EUR pr md
Område
Osnabrück, Niedersachsen
Type
Industrial property
Industrial property in Street - Somerset, South West
More info
We monitor the market!
Industrial property in Street - Somerset, South West
Production for rent in Street - Somerset, South West
Areal
-
Pris pr. md.
Ca. 1,100 GBP pr md
Område
Street - Somerset, South West
Type
Industrial property
Industrial property in Street - Somerset, South West
More info
We monitor the market!
Industrial property in Street - Somerset, South West
Production for rent in Street - Somerset, South West
Areal
-
Pris pr. md.
Ca. 50 GBP pr md
Område
Street - Somerset, South West
Type
Industrial property
Industrial property in Street - Somerset, South West
More info
We monitor the market!
Industrial property in Street - Somerset, South West
Production for rent in Street - Somerset, South West
Areal
-
Pris pr. md.
Ca. 800 GBP pr md
Område
Street - Somerset, South West
Type
Industrial property
Industrial property in Oder-Spree, Brandenburg
More info
We monitor the market!
Industrial property in Oder-Spree, Brandenburg
A versatile logistics and industrial property is available for lease in the established Seefichten Industrial Area, one of the most attractive logistics loca...
Areal
500 - 8,281 m2
Pris pr. md.
Ca. 2,050 EUR pr md
Område
Oder-Spree, Brandenburg
Type
Industrial property
Industrial property in Street - Somerset, South West
More info
We monitor the market!
Industrial property in Street - Somerset, South West
Production for rent in Street - Somerset, South West
Areal
-
Pris pr. md.
Ca. 100 GBP pr md
Område
Street - Somerset, South West
Type
Industrial property
Warehouse in Gdańsk, Pomorskie
More info
We monitor the market!
Warehouse in Gdańsk, Pomorskie
warehouse with an office for production or storage in Gdansk near the highway
Areal
Ca. 1,100 m2
Pris pr. md.
Ca. 8,500 EUR pr md
Område
Gdańsk, Pomorskie
Type
Warehouse
Office space in Pontivy, Bretagne
More info
We monitor the market!
Office space in Pontivy, Bretagne
Office space for rent in Pontivy, Bretagne
Areal
1,000 - 10,000 m2
Pris pr. md.
Ca. 100,000 EUR/mo
Område
Pontivy, Bretagne
Type
Office space
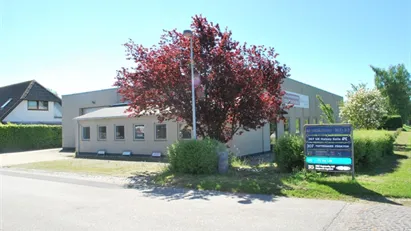
Industrial property in Løgstør, North Jutland Region
More info
We monitor the market!
Industrial property in Løgstør, North Jutland Region
Hyggeligt beliggende landejendom med 1 ha. jord omkranset af høje løvtræer. Beboelse på 128 kvm. Værksted 240 kvm. med 6 stationære velkørende maskiner. Der ...
Areal
Ca. 240 m2
Pris
Ca. 1,000,000EUR
Område
Løgstør, North Jutland Region
Type
Industrial property
Industrial property in Dragoman, Yugozapaden
 More info
Industrial property in Dragoman, Yugozapaden
🏭 WAREHOUSE FOR RENT — KALOTINA | Direct access to Europa Motorway
📍 Sofia Region, Dragoman Municipality, Kalotina
🛣️ Only 2 minutes from the newly bu...
Areal
Ca. 240 m2
Pris pr. md.
Not stated
Område
Dragoman, Yugozapaden
Type
Industrial property
Industrial property in Muri, Aargau (Kantone)
 More info
Industrial property in Muri, Aargau (Kantone)
An der Bahnhofstrasse 27 in CH-5647 Oberrüti vermieten wir ein grosszügiges Gewerbe- und Lagerobjekt mit funktionaler Infrastruktur und flexiblen Nutzungsmög...
Areal
Ca. 3,500 m2
Pris pr. md.
Not stated
Område
Muri, Aargau (Kantone)
Type
Industrial property
Warehouse property in Humlebæk, North Zealand
 More info
Warehouse property in Humlebæk, North Zealand
Warehouse for sale in Humlebæk, North Zealand
Areal
Ca. 770 m2
Pris
Not stated
Område
Humlebæk, North Zealand
Type
Warehouse
Industrial property in Uppsala, Uppsala County
 More info
Industrial property in Uppsala, Uppsala County
Industrial property for rent in Uppsala, Uppsala County
Areal
150 - 950 m2
Pris pr. md.
Not stated
Område
Uppsala, Uppsala County
Type
Industrial property
Industrial property in Uppsala, Uppsala County
 More info
Industrial property in Uppsala, Uppsala County
Industrial property for rent in Uppsala, Uppsala County
Areal
300 - 3,000 m2
Pris pr. md.
Not stated
Område
Uppsala, Uppsala County
Type
Industrial property
Warehouse in Viborg, Central Jutland Region
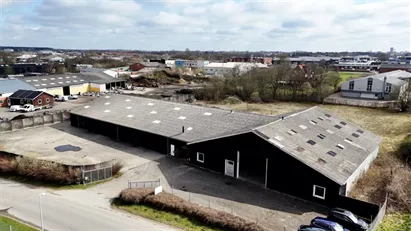 More info
Warehouse in Viborg, Central Jutland Region
Warehouse for rent in Viborg, Central Jutland Region
Areal
300 - 1,656 m2
Pris pr. md.
Not stated
Område
Viborg, Central Jutland Region
Type
Warehouse
Warehouse property in Viborg, Central Jutland Region
 More info
Warehouse property in Viborg, Central Jutland Region
Warehouse for sale in Viborg, Central Jutland Region
Areal
Ca. 1,655 m2
Pris
Not stated
Område
Viborg, Central Jutland Region
Type
Warehouse
Industrial property in Rēzekne, Latgale
 More info
Industrial property in Rēzekne, Latgale
We offer industrial premises for rent - for manufacturing, warehousing and business operations.
Strategic Location
• Just 100 meters from the main road -...
Areal
216 - 4,000 m2
Pris pr. md.
Not stated
Område
Rēzekne, Latgale
Type
Industrial property
Industrial property in Makarska, Splitsko-Dalmatinska
 More info
Industrial property in Makarska, Splitsko-Dalmatinska
Industrial hall/warehouse in Industrial zone of Ciljuge,Živinice,Bosnia and Herzegovina.
Adress:Toplička 2,Kovači
Sq. meters : 82x40 ( + 1st floor )
Sq. m...
Areal
Ca. 3,680 m2
Pris pr. md.
Not stated
Område
Makarska, Splitsko-Dalmatinska
Type
Industrial property
Selected customers
30,000 customers use Companyspace.com
30,000 customers
285,000 companies in our database
2,400 rentals annually
Companyspace.com is used by thousands of landlords, property companies, commercial real estate agents, investors and business centres seeking greater visibility, more enquiries and lower vacancy rates.


