


Industrial properties in Europe
Companyspace.com today:
New today 2,893
Updated 24h 3,920
Notifications about new companyspaces1,736
Amsterdam +3
Berlin +3
Vienna +6
Paris +5
Madrid +4
Dublin (county) +23
Warsaw +19
Greater London +13
Latest update 52 min ago
Active ads 368,913
19,086 industrial properties found
Warehouse in Kłodzki, Dolnośląskie
 More info
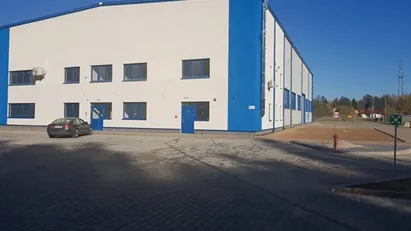
Warehouse in Kłodzki, Dolnośląskie
Perfect location at the Border:
Along national road No. 8.1.5 km from the Kudowa-Słone border crossing.Direct exit from national road No. 8_L
DESCRIPTION:...
Areal
Ca. 1,550 m2
Pris pr. md.
Ca. 15,000 EUR pr md
Område
Kłodzki, Dolnośląskie
Type
Warehouse
Industrial property in Liepāja, Kurzeme
 More info
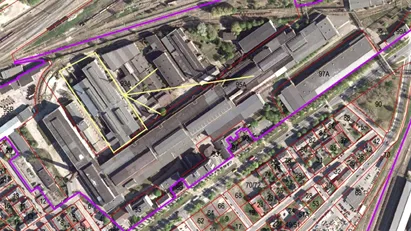
Industrial property in Liepāja, Kurzeme
The owner offers to rent large industrial premises located in Liepaja at [xxxxx] 93a.
The premises are located on the territory of SIA "LIEPĀJAS METALURGS"....
Areal
Ca. 7,175 m2
Pris pr. md.
Ca. 7,000 EUR pr md
Område
Liepāja, Kurzeme
Type
Industrial property
Industrial property in Mangalia, Sud-Est
 More info
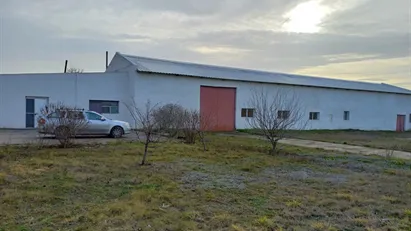
Industrial property in Mangalia, Sud-Est
3 warehouse total 1500 sqm, renovated, yard and cement platform 15000 sqm, utilities full
Areal
Ca. 15,500 m2
Pris pr. md.
Ca. 2,900 EUR pr md
Område
Mangalia, Sud-Est
Type
Industrial property
Warehouse in Mangalia, Sud-Est
 More info
Warehouse in Mangalia, Sud-Est
Warehouse for rent or sale Constanta, Mangalia
For rent or sale yard with 3 halls and direct entrance from DJ391.
The whole yard 1500 Euro + 16%, long ...
Areal
Ca. 1,500 m2
Pris pr. md.
Ca. 3,000 EUR pr md
Område
Mangalia, Sud-Est
Type
Warehouse
Industrial property in Sigtuna, Stockholm County
 More info
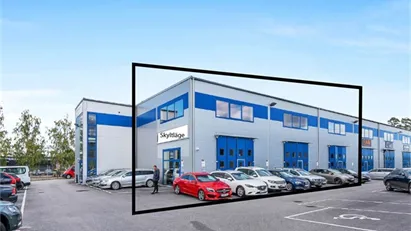
Industrial property in Sigtuna, Stockholm County
Denna artikel kan användas för kontor såväl som lagerförvaring. Varje enhet uppgår till 200 kvadratmeter med egen toalett och kök, totalt finns det 3 enheter...
Areal
200 - 600 m2
Pris pr. md.
Ca. 6,600 EUR pr md
Område
Sigtuna, Stockholm County
Type
Industrial property
Warehouse in Vejle, Vejle (region)
 More info
Warehouse in Vejle, Vejle (region)
Warehouse for rent in Vejle, Vejle (region)
Areal
Ca. 185 m2
Pris pr. md.
Ca. 7,750 DKK pr md
Område
Vejle, Vejle (region)
Type
Warehouse
Warehouse in Vejle, Vejle (region)
More info
Warehouse in Vejle, Vejle (region)
Warehouse for rent in Vejle, Vejle (region)
Areal
Ca. 300 m2
Pris pr. md.
Ca. 12,400 DKK pr md
Område
Vejle, Vejle (region)
Type
Warehouse
Industrial property in Padborg, Region of Southern Denmark
 More info
Industrial property in Padborg, Region of Southern Denmark
Industrial property for rent in Padborg, Region of Southern Denmark
Areal
Ca. 2,390 m2
Pris pr. md.
Ca. 84,100 DKK pr md
Område
Padborg, Region of Southern Denmark
Type
Industrial property
Warehouse in Vejle, Vejle (region)
More info
Warehouse in Vejle, Vejle (region)
Warehouse for rent in Vejle, Vejle (region)
Areal
Ca. 385 m2
Pris pr. md.
Ca. 12,000 DKK pr md
Område
Vejle, Vejle (region)
Type
Warehouse
Warehouse in Vejle, Vejle (region)
 More info
Warehouse in Vejle, Vejle (region)
Warehouse for rent in Vejle, Vejle (region)
Areal
Ca. 100 m2
Pris pr. md.
Ca. 5,650 DKK pr md
Område
Vejle, Vejle (region)
Type
Warehouse
Industrial property in Germersheim, Rheinland-Pfalz
 More info
Industrial property in Germersheim, Rheinland-Pfalz
Zum Verkauf steht eine gepflegte Gewerbeimmobilie bestehend aus zwei separat nutzbaren Hallen, die sich ideal als langfristige Kapitalanlage eignet.
Die e...
Areal
Ca. 3,125 m2
Pris
Ca. 810,000EUR
Område
Germersheim, Rheinland-Pfalz
Type
Industrial property
Industrial property in Stichtse Vecht, Province of Utrecht
 More info
Industrial property in Stichtse Vecht, Province of Utrecht
Bespaar op energiekosten: A+++ Bedrijfsunit te huur in Breukelen!
[xxxxx]
Body: Ondernemers opgelet! Op de Merwedeweg 4A7 hebben wij een splinternieuwe ...
Areal
Ca. 205 m2
Pris pr. md.
Ca. 2,400 EUR pr md
Område
Stichtse Vecht, Province of Utrecht
Type
Industrial property
Industrial property in Zwickau, Sachsen
More info
We monitor the market!
Industrial property in Zwickau, Sachsen
Objektbeschreibung
Diese vielseitig nutzbare Gewerbefläche in Oberplanitz, einem der dynamischsten und am besten angebundenen Gewerbestandorte Zwickau, bi...
Areal
Ca. 580 m2
Pris pr. md.
Ca. 3,200 EUR pr md
Område
Zwickau, Sachsen
Type
Industrial property
Industrial property in Sofia Sredets, Sofia
 More info
Industrial property in Sofia Sredets, Sofia
FOR SALE: Industrial Complex / Logistics–Production Site (Freehold) – Dupnitsa, Bulgaria
Total Land: 35,710 m²
Total GBA: 15,200 m²
Footprint: 12,440 m²...
Areal
Ca. 35,710 m2
Pris
Ca. 4,200,000EUR
Område
Sofia Sredets, Sofia
Type
Industrial property
Industrial property in Plovdiv, Yuzhen Tsentralen
 More info
Industrial property in Plovdiv, Yuzhen Tsentralen
We present to you a strategically located industrial property in the village of Benkovski, offering a wide range of opportunities for industrial development!...
Areal
Ca. 3,405 m2
Pris
Ca. 1,060,000EUR
Område
Plovdiv, Yuzhen Tsentralen
Type
Industrial property
Industrial property in Hamburg Mitte, Hamburg
 More info
Industrial property in Hamburg Mitte, Hamburg
Frei zum 1.11.25 - helle Büro- und Produktionsfläche in Hamburg Hamm-Mitte. 361м2, Netto-Kaltmiete EUR 3430,- Optional 3 Parkplätze TG, EUR 65/St. Geeignet a...
Areal
Ca. 360 m2
Pris pr. md.
Ca. 3,450 EUR pr md
Område
Hamburg Mitte, Hamburg
Type
Industrial property
Industrial property in Gyáli, Közép-Magyarország
 More info
Industrial property in Gyáli, Közép-Magyarország
My prime industrial site in Felsőpakony is available for long-term lease. It is an ideal choice for logistics, industrial, commercial or service activities, ...
Areal
Ca. 20,000 m2
Pris pr. md.
Ca. 1,650 EUR pr md
Område
Gyáli, Közép-Magyarország
Type
Industrial property
Industrial property in Street - Somerset, South West
More info
We monitor the market!
Industrial property in Street - Somerset, South West
Production for rent in Street - Somerset, South West
Areal
-
Pris pr. md.
Ca. 650 GBP pr md
Område
Street - Somerset, South West
Type
Industrial property
Selected customers
30,000 customers use Companyspace.com
30,000 customers
285,000 companies in our database
2,400 rentals annually
Companyspace.com is used by thousands of landlords, property companies, commercial real estate agents, investors and business centres seeking greater visibility, more enquiries and lower vacancy rates.


