


Industrial properties in Europe
Companyspace.com today:
New today 2,893
Updated 24h 3,920
Notifications about new companyspaces1,736
Amsterdam +3
Berlin +3
Vienna +6
Paris +5
Madrid +4
Dublin (county) +23
Warsaw +19
Greater London +13
Latest update 52 min ago
Active ads 368,913
19,086 industrial properties found
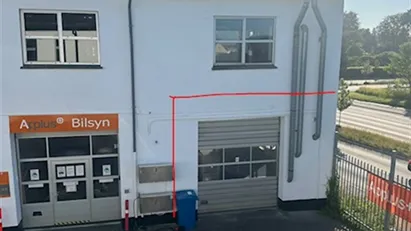
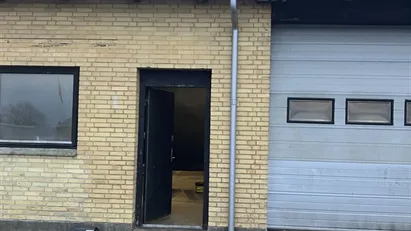
Warehouse in Vejle, Vejle (region)
 More info
Warehouse in Vejle, Vejle (region)
Warehouse for rent in Vejle, Vejle (region)
Areal
Ca. 40 m2
Pris pr. md.
Ca. 3,500 DKK pr md
Område
Vejle, Vejle (region)
Type
Warehouse
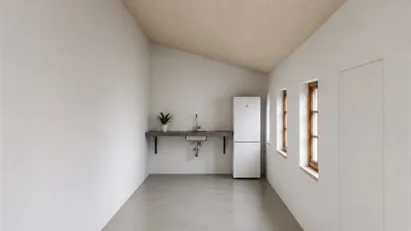
Warehouse in Birkerød, North Zealand
 More info
Warehouse in Birkerød, North Zealand
Warehouse for rent in Birkerød, North Zealand
Areal
Ca. 30 m2
Pris pr. md.
Ca. 5,800 DKK pr md
Område
Birkerød, North Zealand
Type
Warehouse
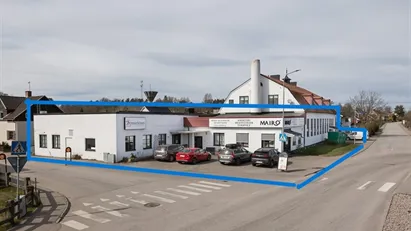
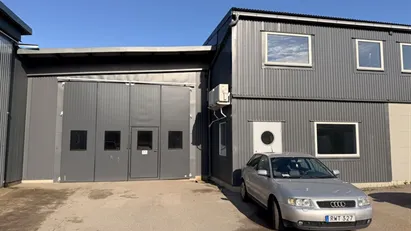
Industrial property in Ronneby, Blekinge County
 More info
Industrial property in Ronneby, Blekinge County
Industrial property for rent in Ronneby, Blekinge County
Areal
Ca. 1,200 m2
Pris pr. md.
Ca. 20,000 SEK pr md
Område
Ronneby, Blekinge County
Type
Industrial property
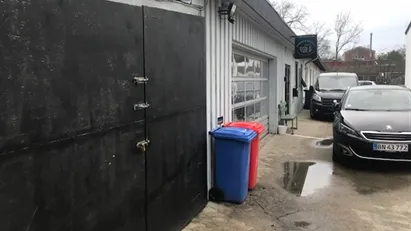
Warehouse in Kastrup, Copenhagen
 More info
Warehouse in Kastrup, Copenhagen
Warehouse for rent in Kastrup, Copenhagen
Areal
Ca. 120 m2
Pris pr. md.
Ca. 13,000 DKK pr md
Område
Kastrup, Copenhagen
Type
Warehouse
Warehouse in Viborg, Central Jutland Region
 More info
Warehouse in Viborg, Central Jutland Region
Warehouse for rent in Viborg, Central Jutland Region
Areal
Ca. 105 m2
Pris pr. md.
Ca. 4,500 DKK pr md
Område
Viborg, Central Jutland Region
Type
Warehouse
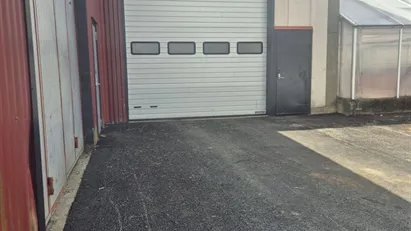
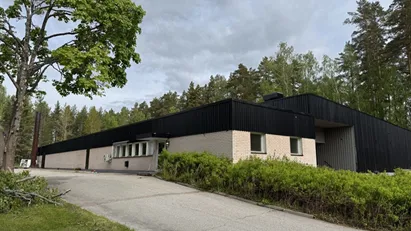
Industrial property in Upplands-Bro, Stockholm County
 More info
Industrial property in Upplands-Bro, Stockholm County
Industrial property for rent in Upplands-Bro, Stockholm County
Areal
Ca. 665 m2
Pris pr. md.
Ca. 30,000 SEK pr md
Område
Upplands-Bro, Stockholm County
Type
Industrial property
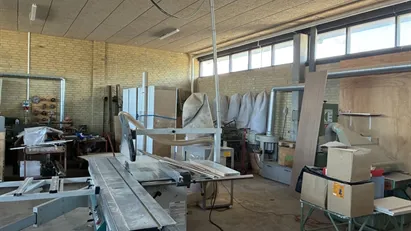
Industrial property in Örebro, Örebro County
 More info
Industrial property in Örebro, Örebro County
Industrial property for rent in Örebro, Örebro County
Areal
Ca. 190 m2
Pris pr. md.
Ca. 12,100 SEK pr md
Område
Örebro, Örebro County
Type
Industrial property
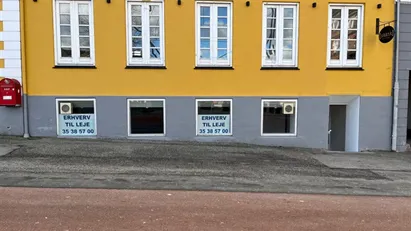
Shop in Hillerød, North Zealand
 More info
Shop in Hillerød, North Zealand
Shop for rent in Hillerød, North Zealand
Areal
Ca. 70 m2
Pris pr. md.
Ca. 6,900 DKK pr md
Område
Hillerød, North Zealand
Type
Shop
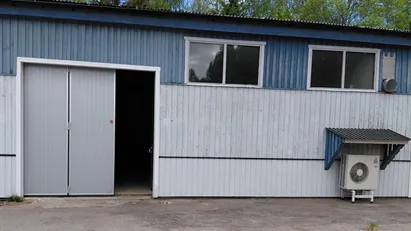
Industrial property in Linköping, Östergötland County
 More info
Industrial property in Linköping, Östergötland County
Industrial property for rent in Linköping, Östergötland County
Areal
Ca. 140 m2
Pris pr. md.
Ca. 11,650 SEK pr md
Område
Linköping, Östergötland County
Type
Industrial property
Warehouse in Trosa, Södermanland County
 More info
Warehouse in Trosa, Södermanland County
Warehouse for rent in Trosa, Södermanland County
Areal
Ca. 405 m2
Pris pr. md.
Ca. 38,600 SEK pr md
Område
Trosa, Södermanland County
Type
Warehouse
Warehouse in Trosa, Södermanland County
 More info
Warehouse in Trosa, Södermanland County
Warehouse for rent in Trosa, Södermanland County
Areal
100 - 200 m2
Pris pr. md.
Ca. 30,000 SEK pr md
Område
Trosa, Södermanland County
Type
Warehouse
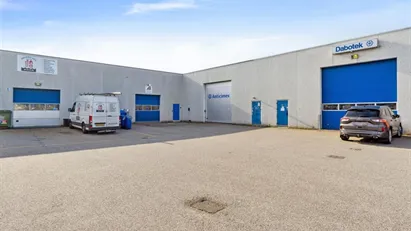
Industrial property in Haninge, Stockholm County
 More info
Industrial property in Haninge, Stockholm County
Industrial property for rent in Haninge, Stockholm County
Areal
Ca. 275 m2
Pris pr. md.
Ca. 15,850 SEK pr md
Område
Haninge, Stockholm County
Type
Industrial property
Warehouse in Falun, Dalarna
 More info
Warehouse in Falun, Dalarna
Warehouse for rent in Falun, Dalarna
Areal
Ca. 1,380 m2
Pris pr. md.
Ca. 92,150 SEK pr md
Område
Falun, Dalarna
Type
Warehouse
Industrial property in Slagelse, Region Zealand
 More info
Industrial property in Slagelse, Region Zealand
Industrial property for rent in Slagelse, Region Zealand
Areal
Ca. 310 m2
Pris pr. md.
Ca. 9,000 DKK pr md
Område
Slagelse, Region Zealand
Type
Industrial property
Industrial property in Norrtälje, Stockholm County
 More info
Industrial property in Norrtälje, Stockholm County
Industrial property for rent in Norrtälje, Stockholm County
Areal
Ca. 140 m2
Pris pr. md.
Ca. 5,000 SEK pr md
Område
Norrtälje, Stockholm County
Type
Industrial property
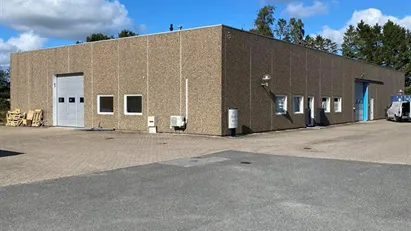
Warehouse in Kolding, Region of Southern Denmark
 More info
Warehouse in Kolding, Region of Southern Denmark
Warehouse for rent in Kolding, Region of Southern Denmark
Areal
Ca. 385 m2
Pris pr. md.
Ca. 16,000 DKK pr md
Område
Kolding, Region of Southern Denmark
Type
Warehouse
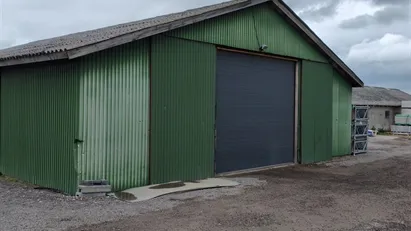
Warehouse in Viby Sjælland, Region Zealand
 More info
Warehouse in Viby Sjælland, Region Zealand
Warehouse for rent in Viby Sjælland, Region Zealand
Areal
Ca. 85 m2
Pris pr. md.
Ca. 5,800 DKK pr md
Område
Viby Sjælland, Region Zealand
Type
Warehouse
Warehouse in Kalundborg, Region Zealand
 More info
Warehouse in Kalundborg, Region Zealand
Warehouse for rent in Kalundborg, Region Zealand
Areal
Ca. 225 m2
Pris pr. md.
Not stated
Område
Kalundborg, Region Zealand
Type
Warehouse
Selected customers
30,000 customers use Companyspace.com
30,000 customers
285,000 companies in our database
2,400 rentals annually
Companyspace.com is used by thousands of landlords, property companies, commercial real estate agents, investors and business centres seeking greater visibility, more enquiries and lower vacancy rates.


