


Industrial properties in Europe
Companyspace.com today:
New today 2,899
Updated 24h 3,921
Notifications about new companyspaces1,937
Copenhagen +2
Stockholm +1
Amsterdam +3
Berlin +3
Vienna +6
Paris +5
Madrid +4
Dublin (county) +23
Warsaw +19
Greater London +13
Latest update 1 h ago
Active ads 369,114
19,081 industrial properties found
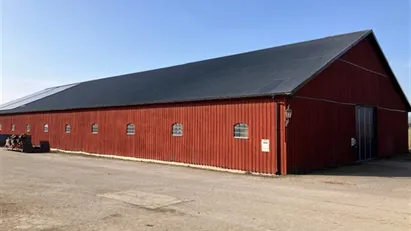
Warehouse in Dianalund, Region Zealand
 More info
Warehouse in Dianalund, Region Zealand
Warehouse for rent in Dianalund, Region Zealand
Areal
1,000 - 6,000 m2
Pris pr. md.
Not stated
Område
Dianalund, Region Zealand
Type
Warehouse
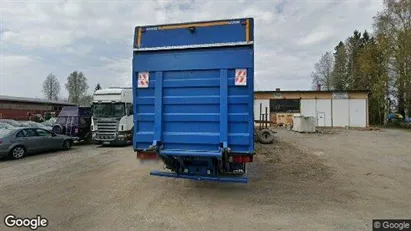
Warehouse in Ringsted, Region Zealand
 More info
Warehouse in Ringsted, Region Zealand
Warehouse for rent in Ringsted, Region Zealand
Areal
Ca. 300 m2
Pris pr. md.
Not stated
Område
Ringsted, Region Zealand
Type
Warehouse
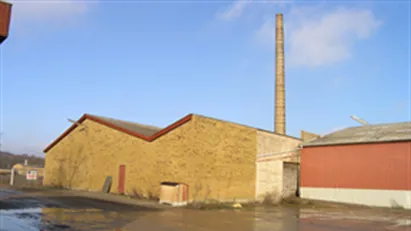
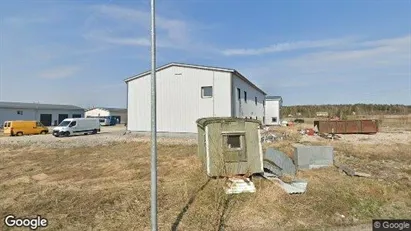
Industrial property in Silkeborg, Central Jutland Region
 More info
Industrial property in Silkeborg, Central Jutland Region
Industrial property for rent in Silkeborg, Central Jutland Region
Areal
Ca. 635 m2
Pris pr. md.
Ca. 12,000 DKK pr md
Område
Silkeborg, Central Jutland Region
Type
Industrial property
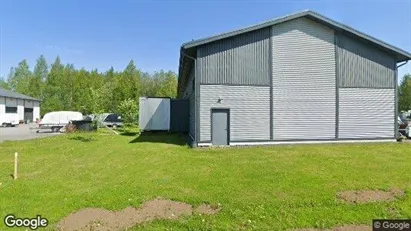
Warehouse in Aarhus C, Aarhus
 More info
Warehouse in Aarhus C, Aarhus
Warehouse for rent in Aarhus C, Aarhus
Areal
Ca. 30 m2
Pris pr. md.
Ca. 4,000 DKK pr md
Område
Aarhus C, Aarhus
Type
Warehouse
Warehouse in Ullerslev, Funen
 More info
Warehouse in Ullerslev, Funen
Warehouse for rent in Ullerslev, Funen
Areal
Ca. 500 m2
Pris pr. md.
Ca. 12,300 DKK pr md
Område
Ullerslev, Funen
Type
Warehouse
Industrial property in Næstved, Region Zealand
 More info
Industrial property in Næstved, Region Zealand
Industrial property for rent in Næstved, Region Zealand
Areal
100 - 2,000 m2
Pris pr. md.
Ca. 58,350 DKK pr md
Område
Næstved, Region Zealand
Type
Industrial property
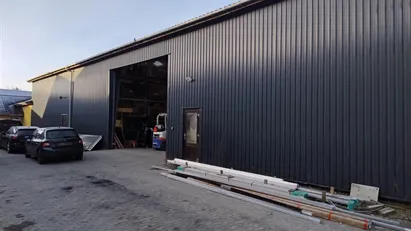
Industrial property in Randers NV, Randers
 More info
Industrial property in Randers NV, Randers
Industrial property for rent in Randers NV, Randers
Areal
500 - 6,000 m2
Pris pr. md.
Ca. 175,000 DKK pr md
Område
Randers NV, Randers
Type
Industrial property
Warehouse in Perstorp, Skåne County
 More info
Warehouse in Perstorp, Skåne County
Warehouse for rent in Perstorp, Skåne County
Areal
Ca. 260 m2
Pris pr. md.
Ca. 10,500 SEK pr md
Område
Perstorp, Skåne County
Type
Warehouse
Industrial property in Svalöv, Skåne County
 More info
Industrial property in Svalöv, Skåne County
Industrial property for rent in Svalöv, Skåne County
Areal
60 - 2,000 m2
Pris pr. md.
Ca. 400 SEK pr md
Område
Svalöv, Skåne County
Type
Industrial property
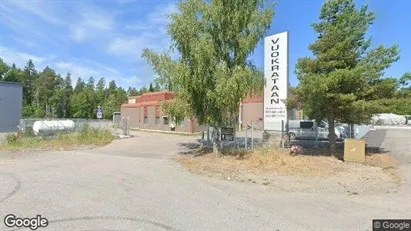
Industrial property in Tampere Lounainen, Tampere
 More info
Industrial property in Tampere Lounainen, Tampere
Industrial property for rent in Tampere Lounainen, Tampere
Areal
Ca. 285 m2
Pris pr. md.
Ca. 1,900 EUR pr md
Område
Tampere Lounainen, Tampere
Type
Industrial property
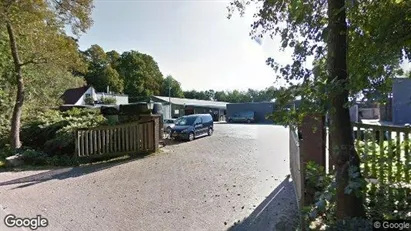
Industrial property in Sipoo, Uusimaa
 More info
Industrial property in Sipoo, Uusimaa
Industrial property for rent in Sipoo, Uusimaa
Areal
39 - 276 m2
Pris pr. md.
Ca. 450 EUR pr md
Område
Sipoo, Uusimaa
Type
Industrial property
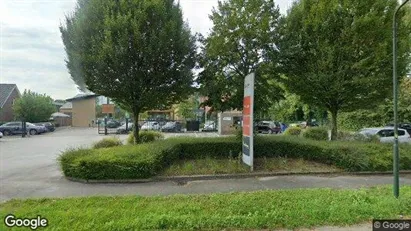
Industrial property in Ylöjärvi, Pirkanmaa
 More info
Industrial property in Ylöjärvi, Pirkanmaa
Industrial property for rent in Ylöjärvi, Pirkanmaa
Areal
Ca. 100 m2
Pris pr. md.
Ca. 900 EUR pr md
Område
Ylöjärvi, Pirkanmaa
Type
Industrial property
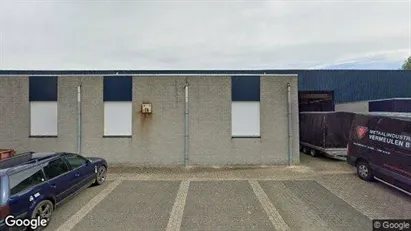
Industrial property in Kaarina, Varsinais-Suomi
 More info
Industrial property in Kaarina, Varsinais-Suomi
Industrial property for rent in Kaarina, Varsinais-Suomi
Areal
Ca. 1,115 m2
Pris pr. md.
Ca. 6,150 EUR pr md
Område
Kaarina, Varsinais-Suomi
Type
Industrial property
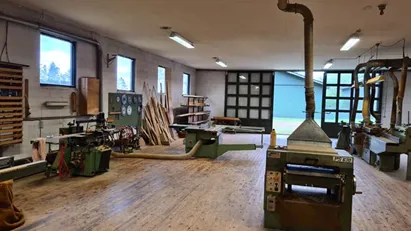
Industrial property in Randers SV, Central Jutland Region
 More info
Industrial property in Randers SV, Central Jutland Region
Industrial property for rent in Randers SV, Central Jutland Region
Areal
Ca. 505 m2
Pris pr. md.
Ca. 19,000 DKK pr md
Område
Randers SV, Central Jutland Region
Type
Industrial property
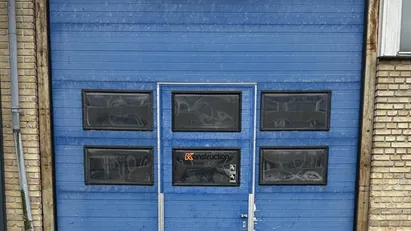
Industrial property in Mitcham - Surrey, Greater London
 More info
Industrial property in Mitcham - Surrey, Greater London
Production for rent in Mitcham - Surrey, Greater London
Areal
-
Pris pr. md.
Ca. 3,400 GBP pr md
Område
Mitcham - Surrey, Greater London
Type
Industrial property
Industrial property in Soest, Province of Utrecht
 More info
Industrial property in Soest, Province of Utrecht
Productie te huur in Soest, Utrecht-provincie
Areal
Ca. 100 m2
Pris pr. md.
Ca. 1,050 EUR pr md
Område
Soest, Province of Utrecht
Type
Industrial property
Industrial property in Bladel, North Brabant
 More info
Industrial property in Bladel, North Brabant
Industrial property for rent in Bladel, North Brabant
Areal
Ca. 970 m2
Pris pr. md.
Ca. 3,450 EUR pr md
Område
Bladel, North Brabant
Type
Industrial property
Industrial property in Bladel, North Brabant
 More info
Industrial property in Bladel, North Brabant
Industrial property for rent in Bladel, North Brabant
Areal
Ca. 130 m2
Pris pr. md.
Ca. 1,150 EUR pr md
Område
Bladel, North Brabant
Type
Industrial property
Selected customers
30,000 customers use Companyspace.com
30,000 customers
285,000 companies in our database
2,400 rentals annually
Companyspace.com is used by thousands of landlords, property companies, commercial real estate agents, investors and business centres seeking greater visibility, more enquiries and lower vacancy rates.


