


Industrial properties in Europe
Companyspace.com today:
New today 2,893
Updated 24h 3,920
Notifications about new companyspaces1,736
Amsterdam +3
Berlin +3
Vienna +6
Paris +5
Madrid +4
Dublin (county) +23
Warsaw +19
Greater London +13
Latest update 50 min ago
Active ads 368,913
19,086 industrial properties found
Industrial property in Malmö City, Malmö
 More info
Industrial property in Malmö City, Malmö
Industrial property for rent in Malmö City, Malmö
Areal
Ca. 515 m2
Pris pr. md.
Not stated
Område
Malmö City, Malmö
Type
Industrial property
Industrial property in Svedala, Skåne County
 More info
Industrial property in Svedala, Skåne County
Industrial property for rent in Svedala, Skåne County
Areal
Ca. 145 m2
Pris pr. md.
Not stated
Område
Svedala, Skåne County
Type
Industrial property
Industrial property in Malmö City, Malmö
 More info
Industrial property in Malmö City, Malmö
Industrial property for rent in Malmö City, Malmö
Areal
Ca. 1,400 m2
Pris pr. md.
Not stated
Område
Malmö City, Malmö
Type
Industrial property
Industrial property in Rosengård, Malmö
 More info
Industrial property in Rosengård, Malmö
Industrial property for rent in Rosengård, Malmö
Areal
Ca. 1,540 m2
Pris pr. md.
Not stated
Område
Rosengård, Malmö
Type
Industrial property
Industrial property in Norrköping, Östergötland County
 More info
Industrial property in Norrköping, Östergötland County
Industrial property for rent in Norrköping, Östergötland County
Areal
Ca. 200 m2
Pris pr. md.
Not stated
Område
Norrköping, Östergötland County
Type
Industrial property
Industrial property in Stockholm West, Stockholm
 More info
Industrial property in Stockholm West, Stockholm
Industrial property for rent in Stockholm West, Stockholm
Areal
Ca. 1,040 m2
Pris pr. md.
Not stated
Område
Stockholm West, Stockholm
Type
Industrial property
Industrial property in Västerås, Västmanland County
 More info
Industrial property in Västerås, Västmanland County
Industrial property for rent in Västerås, Västmanland County
Areal
1,675 - 2,372 m2
Pris pr. md.
Not stated
Område
Västerås, Västmanland County
Type
Industrial property
Industrial property in Södertälje, Stockholm County
 More info
Industrial property in Södertälje, Stockholm County
Industrial property for rent in Södertälje, Stockholm County
Areal
Ca. 650 m2
Pris pr. md.
Not stated
Område
Södertälje, Stockholm County
Type
Industrial property
Industrial property in Uppsala, Uppsala County
 More info
Industrial property in Uppsala, Uppsala County
Industrial property for rent in Uppsala, Uppsala County
Areal
Ca. 550 m2
Pris pr. md.
Not stated
Område
Uppsala, Uppsala County
Type
Industrial property
Industrial property in Landskrona, Skåne County
 More info
Industrial property in Landskrona, Skåne County
Industrial property for rent in Landskrona, Skåne County
Areal
Ca. 800 m2
Pris pr. md.
Not stated
Område
Landskrona, Skåne County
Type
Industrial property
Industrial property in Södertälje, Stockholm County
 More info
Industrial property in Södertälje, Stockholm County
Industrial property for rent in Södertälje, Stockholm County
Areal
Ca. 1,000 m2
Pris pr. md.
Not stated
Område
Södertälje, Stockholm County
Type
Industrial property
Industrial property in Ystad, Skåne County
 More info
Industrial property in Ystad, Skåne County
Industrial property for rent in Ystad, Skåne County
Areal
Ca. 195 m2
Pris pr. md.
Not stated
Område
Ystad, Skåne County
Type
Industrial property
Industrial property in Uppsala, Uppsala County
 More info
Industrial property in Uppsala, Uppsala County
Industrial property for rent in Uppsala, Uppsala County
Areal
Ca. 11,650 m2
Pris pr. md.
Not stated
Område
Uppsala, Uppsala County
Type
Industrial property
Industrial property in Fosie, Malmö
 More info
Industrial property in Fosie, Malmö
Industrial property for rent in Fosie, Malmö
Areal
Ca. 440 m2
Pris pr. md.
Not stated
Område
Fosie, Malmö
Type
Industrial property
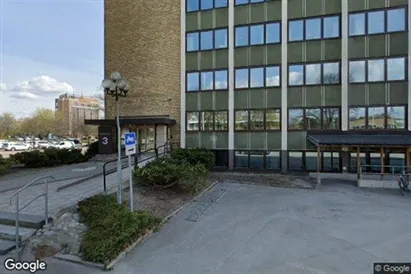
Industrial property in Kirseberg, Malmö
 More info
Industrial property in Kirseberg, Malmö
Industrial property for rent in Kirseberg, Malmö
Areal
Ca. 1,250 m2
Pris pr. md.
Not stated
Område
Kirseberg, Malmö
Type
Industrial property
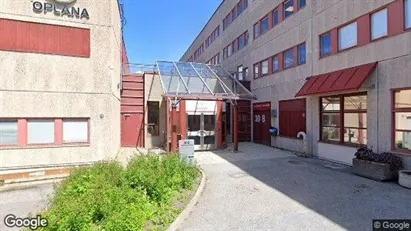
Industrial property in Landskrona, Skåne County
 More info
Industrial property in Landskrona, Skåne County
Industrial property for rent in Landskrona, Skåne County
Areal
Ca. 3,845 m2
Pris pr. md.
Not stated
Område
Landskrona, Skåne County
Type
Industrial property
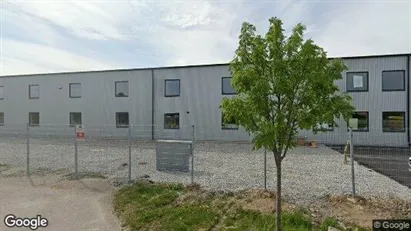
Industrial property in Gothenburg East, Gothenburg
 More info
Industrial property in Gothenburg East, Gothenburg
Industrial property for rent in Gothenburg East, Gothenburg
Areal
Ca. 235 m2
Pris pr. md.
Not stated
Område
Gothenburg East, Gothenburg
Type
Industrial property
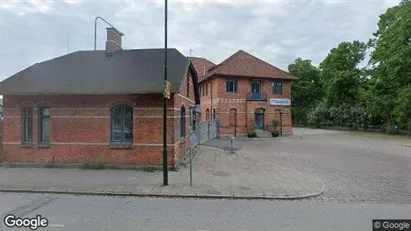
Industrial property in Trelleborg, Skåne County
 More info
Industrial property in Trelleborg, Skåne County
Industrial property for rent in Trelleborg, Skåne County
Areal
Ca. 3,140 m2
Pris pr. md.
Not stated
Område
Trelleborg, Skåne County
Type
Industrial property
Selected customers
30,000 customers use Companyspace.com
30,000 customers
285,000 companies in our database
2,400 rentals annually
Companyspace.com is used by thousands of landlords, property companies, commercial real estate agents, investors and business centres seeking greater visibility, more enquiries and lower vacancy rates.


