


Industrial properties in Europe
Companyspace.com today:
New today 2,893
Updated 24h 3,920
Notifications about new companyspaces1,736
Amsterdam +3
Berlin +3
Vienna +6
Paris +5
Madrid +4
Dublin (county) +23
Warsaw +19
Greater London +13
Latest update 50 min ago
Active ads 368,913
19,086 industrial properties found
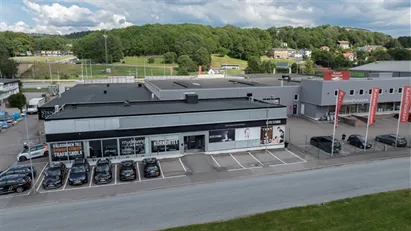
Shop in Stockholm West, Stockholm
More info
Shop in Stockholm West, Stockholm
Shop for rent in Stockholm West, Stockholm
Areal
1,200 m2
Pris pr. md.
Not stated
Område
Stockholm West, Stockholm
Type
Shop
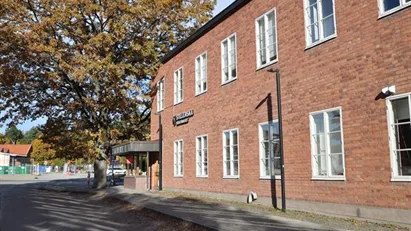
Office space in Gävle, Gävleborg County
More info
Office space in Gävle, Gävleborg County
Office space for rent in Gävle, Gävleborg County
Areal
6,000 m2
Pris pr. md.
Not stated
Område
Gävle, Gävleborg County
Type
Office space
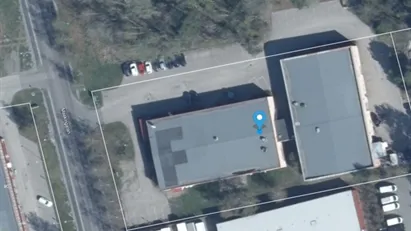
Office space in Norrköping, Östergötland County
More info
Office space in Norrköping, Östergötland County
Office space for rent in Norrköping, Östergötland County
Areal
606 m2
Pris pr. md.
Not stated
Område
Norrköping, Östergötland County
Type
Office space
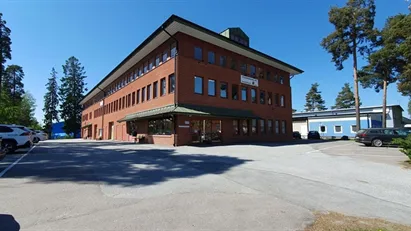
Shop in Sollentuna, Stockholm County
More info
Shop in Sollentuna, Stockholm County
Shop for rent in Sollentuna, Stockholm County
Areal
180 m2
Pris pr. md.
Not stated
Område
Sollentuna, Stockholm County
Type
Shop
Office space in Burlöv, Skåne County
More info
Office space in Burlöv, Skåne County
Office space for rent in Burlöv, Skåne County
Areal
440 m2
Pris pr. md.
Not stated
Område
Burlöv, Skåne County
Type
Office space
Office space in Sigtuna, Stockholm County
More info
Office space in Sigtuna, Stockholm County
Office space for rent in Sigtuna, Stockholm County
Areal
362 m2
Pris pr. md.
Not stated
Område
Sigtuna, Stockholm County
Type
Office space
Office space in Burlöv, Skåne County
More info
Office space in Burlöv, Skåne County
Office space for rent in Burlöv, Skåne County
Areal
520 m2
Pris pr. md.
Not stated
Område
Burlöv, Skåne County
Type
Office space
Office space in Gävle, Gävleborg County
More info
Office space in Gävle, Gävleborg County
Office space for rent in Gävle, Gävleborg County
Areal
6,000 m2
Pris pr. md.
Not stated
Område
Gävle, Gävleborg County
Type
Office space
Office space in Mölndal, Västra Götaland County
More info
Office space in Mölndal, Västra Götaland County
Office space for rent in Mölndal, Västra Götaland County
Areal
270 m2
Pris pr. md.
Not stated
Område
Mölndal, Västra Götaland County
Type
Office space
Office space in Lidingö, Stockholm County
More info
Office space in Lidingö, Stockholm County
Office space for rent in Lidingö, Stockholm County
Areal
328 m2
Pris pr. md.
Not stated
Område
Lidingö, Stockholm County
Type
Office space
Shop in Sigtuna, Stockholm County
More info
Shop in Sigtuna, Stockholm County
Shop for rent in Sigtuna, Stockholm County
Areal
1,000 m2
Pris pr. md.
Not stated
Område
Sigtuna, Stockholm County
Type
Shop
Office space in Sigtuna, Stockholm County
More info
Office space in Sigtuna, Stockholm County
Office space for rent in Sigtuna, Stockholm County
Areal
261 m2
Pris pr. md.
Not stated
Område
Sigtuna, Stockholm County
Type
Office space
Industrial property in Sigtuna, Stockholm County
More info
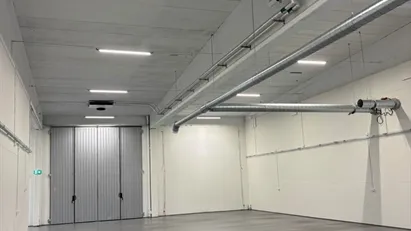
Industrial property in Sigtuna, Stockholm County
Industrial property for rent in Sigtuna, Stockholm County
Areal
414 m2
Pris pr. md.
Not stated
Område
Sigtuna, Stockholm County
Type
Industrial property
Office space in Burlöv, Skåne County
More info
Office space in Burlöv, Skåne County
Office space for rent in Burlöv, Skåne County
Areal
264 m2
Pris pr. md.
Not stated
Område
Burlöv, Skåne County
Type
Office space
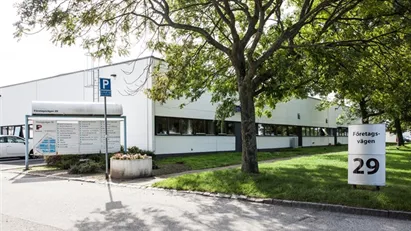
Office space in Gävle, Gävleborg County
More info
Office space in Gävle, Gävleborg County
Office space for rent in Gävle, Gävleborg County
Areal
348 m2
Pris pr. md.
Not stated
Område
Gävle, Gävleborg County
Type
Office space
Office space in Hedemora, Dalarna
More info
Office space in Hedemora, Dalarna
Office space for rent in Hedemora, Dalarna
Areal
788 m2
Pris pr. md.
Not stated
Område
Hedemora, Dalarna
Type
Office space
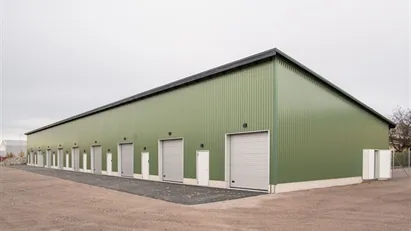
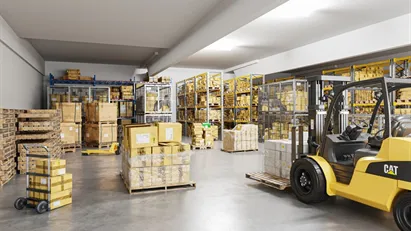
Warehouse in Glostrup, Greater Copenhagen
 More info
Warehouse in Glostrup, Greater Copenhagen
Warehouse for rent in Glostrup, Greater Copenhagen
Areal
15 - 100 m2
Pris pr. md.
5,417 DKK pr md
Område
Glostrup, Greater Copenhagen
Type
Warehouse
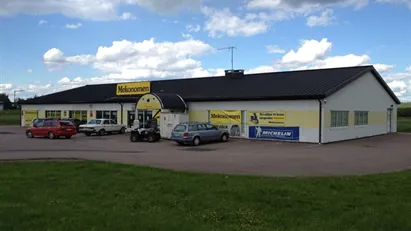
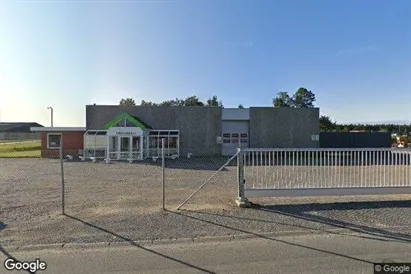
Industrial property in Hadsund, North Jutland Region
 More info
Industrial property in Hadsund, North Jutland Region
Industrial property for rent in Hadsund, North Jutland Region
Areal
685 m2
Pris pr. md.
Not stated
Område
Hadsund, North Jutland Region
Type
Industrial property
Selected customers
30,000 customers use Companyspace.com
30,000 customers
285,000 companies in our database
2,400 rentals annually
Companyspace.com is used by thousands of landlords, property companies, commercial real estate agents, investors and business centres seeking greater visibility, more enquiries and lower vacancy rates.


