


Industrial properties in Europe
Companyspace.com today:
New today 2,899
Updated 24h 3,921
Notifications about new companyspaces1,854
Copenhagen +2
Stockholm +1
Amsterdam +3
Berlin +3
Vienna +6
Paris +5
Madrid +4
Dublin (county) +23
Warsaw +19
Greater London +13
Latest update 16 min ago
Active ads 369,114
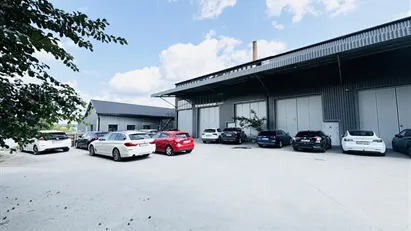
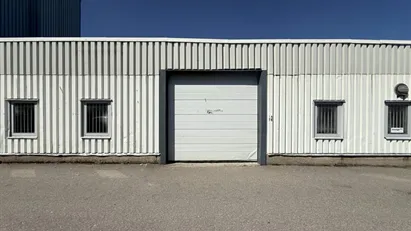
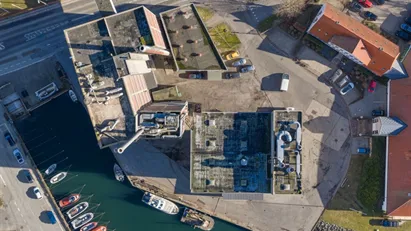
19,081 industrial properties found
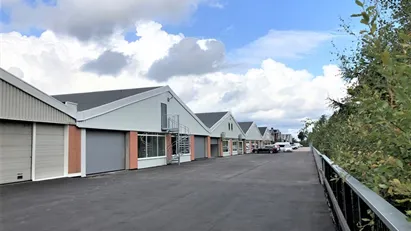
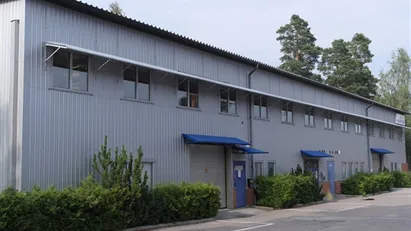
Industrial property in Upplands-Bro, Stockholm County
More info
Industrial property in Upplands-Bro, Stockholm County
Industrial property for rent in Upplands-Bro, Stockholm County
Areal
1,175 m2
Pris pr. md.
Not stated
Område
Upplands-Bro, Stockholm County
Type
Industrial property
Industrial property in Strängnäs, Södermanland County
More info
Industrial property in Strängnäs, Södermanland County
Industrial property for rent in Strängnäs, Södermanland County
Areal
158 m2
Pris pr. md.
Not stated
Område
Strängnäs, Södermanland County
Type
Industrial property
Industrial property in Järfälla, Stockholm County
More info
Industrial property in Järfälla, Stockholm County
Industrial property for rent in Järfälla, Stockholm County
Areal
192 m2
Pris pr. md.
Not stated
Område
Järfälla, Stockholm County
Type
Industrial property
Industrial property in Svendborg, Funen
More info

Industrial property in Svendborg, Funen
Industrial property for rent in Svendborg, Funen
Areal
-
Pris pr. md.
Not stated
Område
Svendborg, Funen
Type
Industrial property
Industrial property in Järfälla, Stockholm County
More info
Industrial property in Järfälla, Stockholm County
Industrial property for rent in Järfälla, Stockholm County
Areal
335 m2
Pris pr. md.
Not stated
Område
Järfälla, Stockholm County
Type
Industrial property
Industrial property in Sundsvall, Västernorrland County
More info
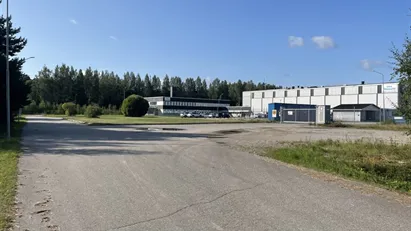
Industrial property in Sundsvall, Västernorrland County
Industrial property for rent in Sundsvall, Västernorrland County
Areal
1,500 m2
Pris pr. md.
Not stated
Område
Sundsvall, Västernorrland County
Type
Industrial property
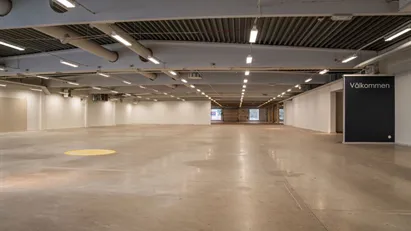
Warehouse in Huddinge, Stockholm County
More info
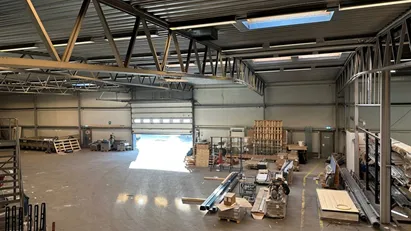
Warehouse in Huddinge, Stockholm County
Warehouse for rent in Huddinge, Stockholm County
Areal
1,355 m2
Pris pr. md.
Not stated
Område
Huddinge, Stockholm County
Type
Warehouse
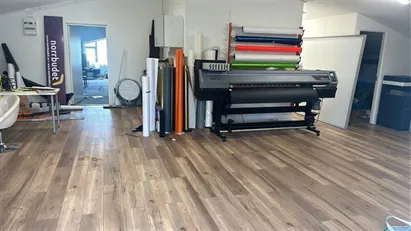
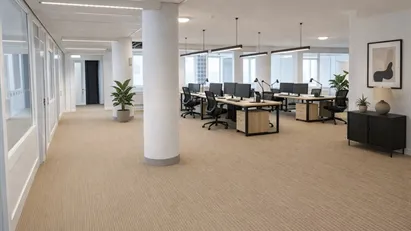
Office space in Solna, Stockholm County
More info
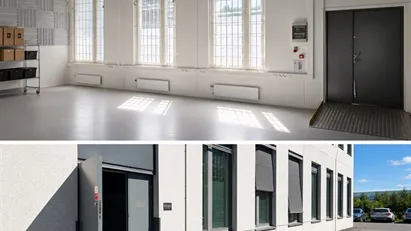
Office space in Solna, Stockholm County
Office space for rent in Solna, Stockholm County
Areal
327 m2
Pris pr. md.
Not stated
Område
Solna, Stockholm County
Type
Office space
Industrial property in Sigtuna, Stockholm County
More info
Industrial property in Sigtuna, Stockholm County
Industrial property for rent in Sigtuna, Stockholm County
Areal
65 m2
Pris pr. md.
Not stated
Område
Sigtuna, Stockholm County
Type
Industrial property
Office space in Askim-Frölunda-Högsbo, Gothenburg
More info
Office space in Askim-Frölunda-Högsbo, Gothenburg
Office space for rent in Askim-Frölunda-Högsbo, Gothenburg
Areal
306 m2
Pris pr. md.
Not stated
Område
Askim-Frölunda-Högsbo, Gothenburg
Type
Office space
Office space in Västra hisingen, Gothenburg
More info
Office space in Västra hisingen, Gothenburg
Office space for rent in Västra hisingen, Gothenburg
Areal
1,150 m2
Pris pr. md.
Not stated
Område
Västra hisingen, Gothenburg
Type
Office space
Office space in Burlöv, Skåne County
More info
Office space in Burlöv, Skåne County
Office space for rent in Burlöv, Skåne County
Areal
264 m2
Pris pr. md.
Not stated
Område
Burlöv, Skåne County
Type
Office space
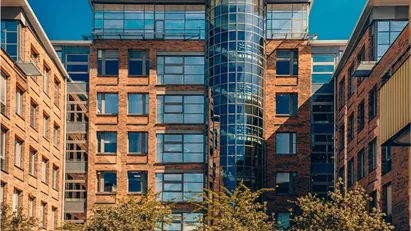
Industrial property in Stockholm West, Stockholm
More info
Industrial property in Stockholm West, Stockholm
Industrial property for rent in Stockholm West, Stockholm
Areal
2,830 m2
Pris pr. md.
Not stated
Område
Stockholm West, Stockholm
Type
Industrial property
Office space in Sigtuna, Stockholm County
More info
Office space in Sigtuna, Stockholm County
Office space for rent in Sigtuna, Stockholm County
Areal
287 m2
Pris pr. md.
Not stated
Område
Sigtuna, Stockholm County
Type
Office space
Industrial property in Solna, Stockholm County
More info
Industrial property in Solna, Stockholm County
Industrial property for rent in Solna, Stockholm County
Areal
260 m2
Pris pr. md.
Not stated
Område
Solna, Stockholm County
Type
Industrial property
Shop in Gävle, Gävleborg County
More info
Shop in Gävle, Gävleborg County
Shop for rent in Gävle, Gävleborg County
Areal
2,761 m2
Pris pr. md.
Not stated
Område
Gävle, Gävleborg County
Type
Shop
Office space in Sigtuna, Stockholm County
More info

Office space in Sigtuna, Stockholm County
Office space for rent in Sigtuna, Stockholm County
Areal
600 m2
Pris pr. md.
Not stated
Område
Sigtuna, Stockholm County
Type
Office space
Industrial property in Stockholm West, Stockholm
More info
Industrial property in Stockholm West, Stockholm
Industrial property for rent in Stockholm West, Stockholm
Areal
4,481 m2
Pris pr. md.
Not stated
Område
Stockholm West, Stockholm
Type
Industrial property
Selected customers
30,000 customers use Companyspace.com
30,000 customers
285,000 companies in our database
2,400 rentals annually
Companyspace.com is used by thousands of landlords, property companies, commercial real estate agents, investors and business centres seeking greater visibility, more enquiries and lower vacancy rates.


