


Photo provided by Google Street View and may be inaccurate:
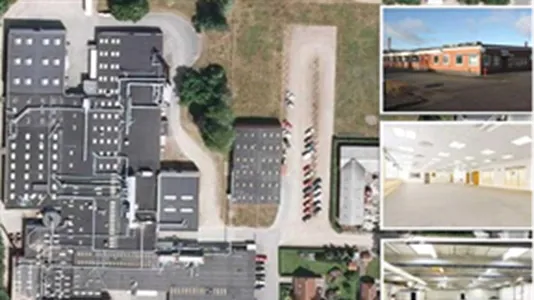
Industrial property for rent, Agerbæk, Region of Southern Denmark, Østergade 27
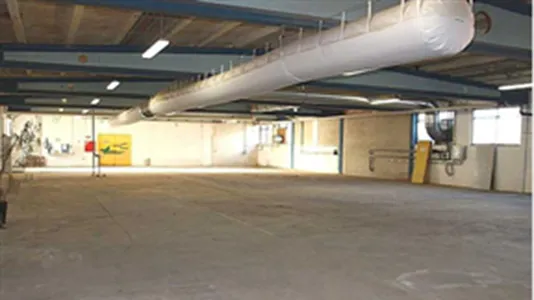
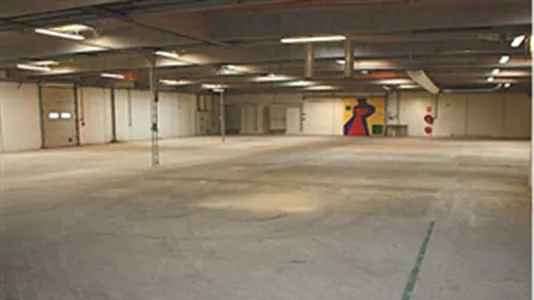
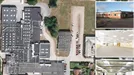
Østergade 27, 6753 Agerbæk- Industrial property for rent
- 500 - 10,300 m2
- Ca. 150,200 DKK per month
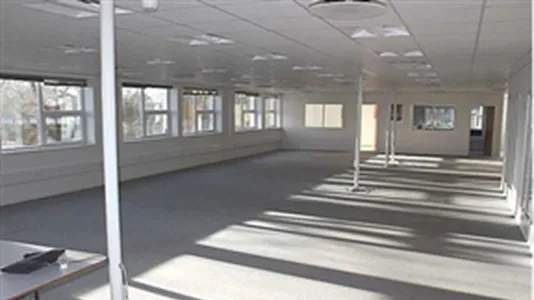
Østergade 27, 6753 Agerbæk
- Industrial property for rent
- 500 - 10,300 m2
- Ca. 150,200 DKK per month


