


Photo provided by Google Street View and may be inaccurate:
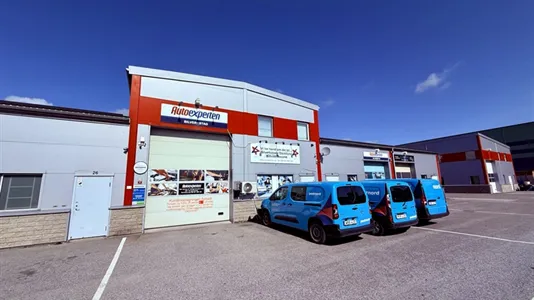


Industrial property for rent, Haninge, Stockholm County, Dåntorpsvägen Lokal 27
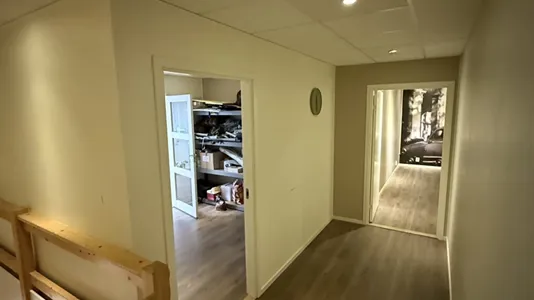
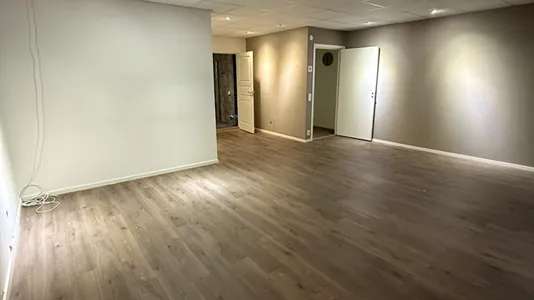
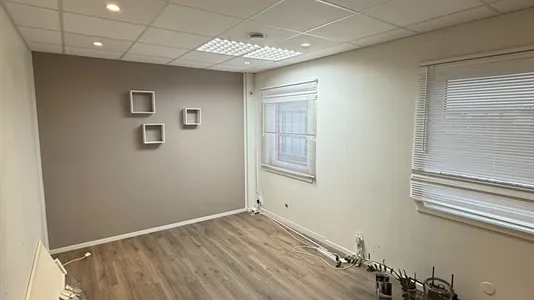
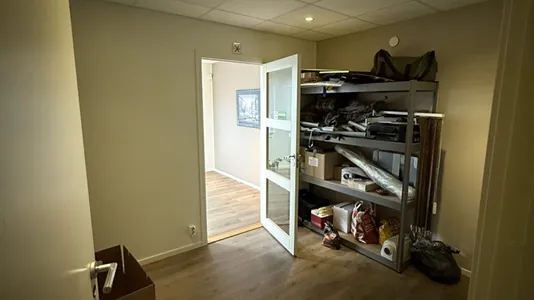
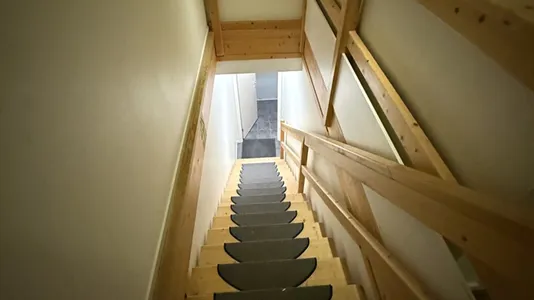
Dåntorpsvägen Lokal 27, Haninge- Industrial property for rent
- Ca. 195 m2
- Ca. 21,500 SEK per month

Dåntorpsvägen Lokal 27, Haninge
- Industrial property for rent
- Ca. 195 m2
- Ca. 21,500 SEK per month
Industrial property for rent, Haninge, Stockholm County, Dåntorpsvägen Lokal 27
Facts
Report- 3593431
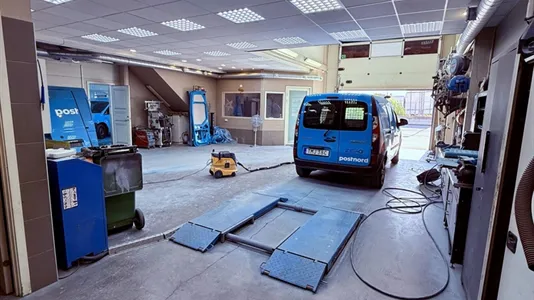
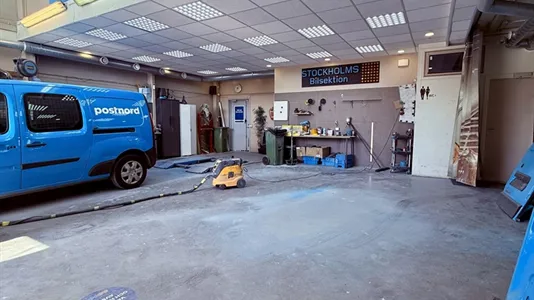
- Industrial property
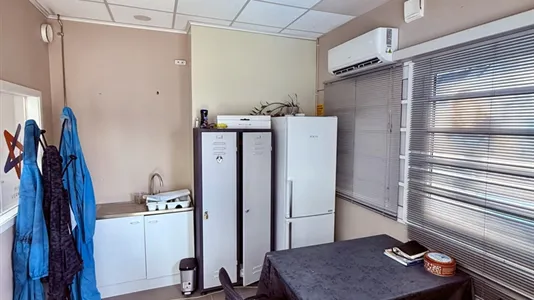
- Office space
- Ca. 195 m2
- Ca. 258,000 SEK
- Ca. 21,500 SEK
- Ca. 1,300 SEK

")


