


Industrial properties in Finland
Companyspace.com today:
New today 875
Updated 24h 1,838
Notifications about new companyspaces6,715
Copenhagen +1
Stockholm +1
Berlin +115
Vienna +12
Roma (region) +1
Greater London +1
Latest update 3 h ago
Active ads 365,845
3,019 industrial properties found
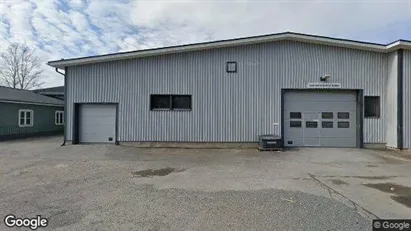
Industrial property in Kokkola, Keski-Pohjanmaa
 More info
Industrial property in Kokkola, Keski-Pohjanmaa
Industrial property for sale in Kokkola, Keski-Pohjanmaa
Areal
Ca. 2,130 m2
Pris
Not stated
Område
Kokkola, Keski-Pohjanmaa
Type
Industrial property
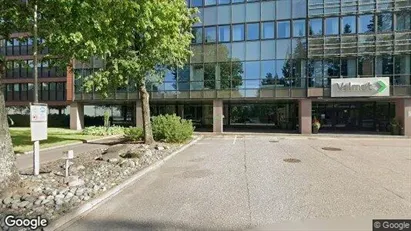
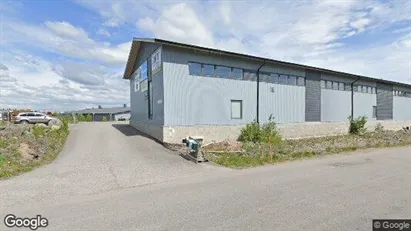
Industrial property in Vantaa, Uusimaa
 More info
Industrial property in Vantaa, Uusimaa
Industrial property for rent in Vantaa, Uusimaa
Areal
Ca. 3,300 m2
Pris pr. md.
Not stated
Område
Vantaa, Uusimaa
Type
Industrial property
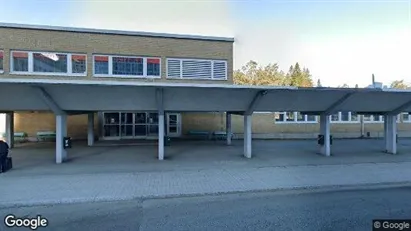
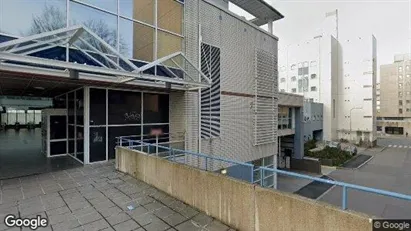
Industrial property in Helsinki Itäinen, Helsinki
 More info
Industrial property in Helsinki Itäinen, Helsinki
Industrial property for rent in Helsinki Itäinen, Helsinki
Areal
Ca. 450 m2
Pris pr. md.
Not stated
Område
Helsinki Itäinen, Helsinki
Type
Industrial property
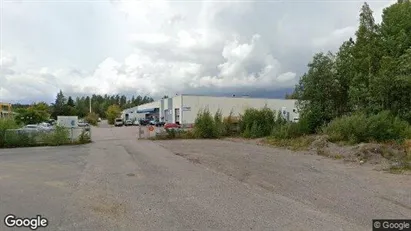
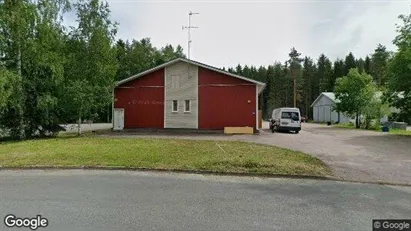
Industrial property in Kuopio, Pohjois-Savo
 More info
Industrial property in Kuopio, Pohjois-Savo
Industrial property for rent in Kuopio, Pohjois-Savo
Areal
Ca. 345 m2
Pris pr. md.
Not stated
Område
Kuopio, Pohjois-Savo
Type
Industrial property
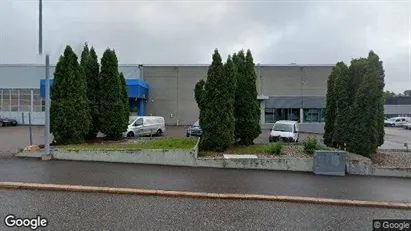
Industrial property in Järvenpää, Uusimaa
 More info
Industrial property in Järvenpää, Uusimaa
Industrial property for rent in Järvenpää, Uusimaa
Areal
Ca. 3,860 m2
Pris pr. md.
Not stated
Område
Järvenpää, Uusimaa
Type
Industrial property
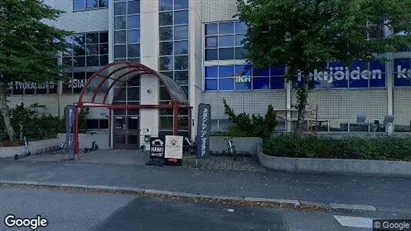
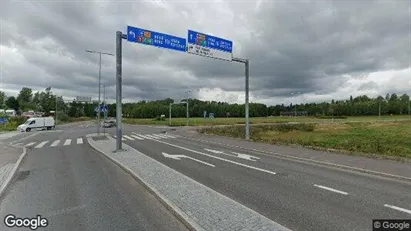
Industrial property in Helsinki Keskinen, Helsinki
 More info
Industrial property in Helsinki Keskinen, Helsinki
Industrial property for rent in Helsinki Keskinen, Helsinki
Areal
Ca. 380 m2
Pris pr. md.
Not stated
Område
Helsinki Keskinen, Helsinki
Type
Industrial property
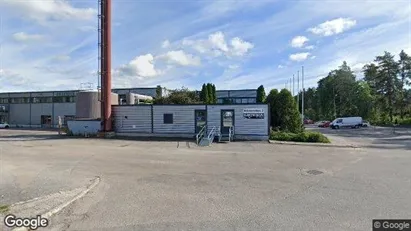
Industrial property in Turku, Varsinais-Suomi
 More info
Industrial property in Turku, Varsinais-Suomi
Industrial property for rent in Turku, Varsinais-Suomi
Areal
Ca. 240 m2
Pris pr. md.
Not stated
Område
Turku, Varsinais-Suomi
Type
Industrial property
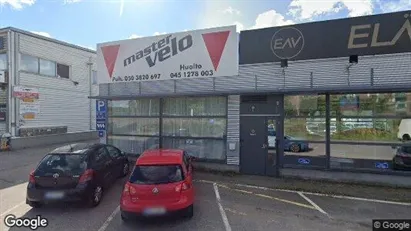
Industrial property in Kuopio, Pohjois-Savo
 More info
Industrial property in Kuopio, Pohjois-Savo
Industrial property for rent in Kuopio, Pohjois-Savo
Areal
Ca. 190 m2
Pris pr. md.
Not stated
Område
Kuopio, Pohjois-Savo
Type
Industrial property
Industrial property in Helsinki Itäinen, Helsinki
 More info
Industrial property in Helsinki Itäinen, Helsinki
Industrial property for rent in Helsinki Itäinen, Helsinki
Areal
Ca. 10 m2
Pris pr. md.
Not stated
Område
Helsinki Itäinen, Helsinki
Type
Industrial property
Industrial property in Turku, Varsinais-Suomi
 More info
Industrial property in Turku, Varsinais-Suomi
Industrial property for rent in Turku, Varsinais-Suomi
Areal
Ca. 2,275 m2
Pris pr. md.
Not stated
Område
Turku, Varsinais-Suomi
Type
Industrial property
Industrial property in Helsinki Itäinen, Helsinki
 More info
Industrial property in Helsinki Itäinen, Helsinki
Industrial property for rent in Helsinki Itäinen, Helsinki
Areal
Ca. 40 m2
Pris pr. md.
Not stated
Område
Helsinki Itäinen, Helsinki
Type
Industrial property
Industrial property in Kuopio, Pohjois-Savo
 More info
Industrial property in Kuopio, Pohjois-Savo
Industrial property for rent in Kuopio, Pohjois-Savo
Areal
Ca. 100 m2
Pris pr. md.
Not stated
Område
Kuopio, Pohjois-Savo
Type
Industrial property
Industrial property in Naantali, Varsinais-Suomi
 More info
Industrial property in Naantali, Varsinais-Suomi
Industrial property for rent in Naantali, Varsinais-Suomi
Areal
-
Pris pr. md.
Not stated
Område
Naantali, Varsinais-Suomi
Type
Industrial property
Industrial property in Hyvinkää, Uusimaa
 More info
Industrial property in Hyvinkää, Uusimaa
Industrial property for rent in Hyvinkää, Uusimaa
Areal
-
Pris pr. md.
Not stated
Område
Hyvinkää, Uusimaa
Type
Industrial property
Industrial property in Helsinki Itäinen, Helsinki
 More info
Industrial property in Helsinki Itäinen, Helsinki
Industrial property for rent in Helsinki Itäinen, Helsinki
Areal
Ca. 195 m2
Pris pr. md.
Not stated
Område
Helsinki Itäinen, Helsinki
Type
Industrial property
Industrial property in Helsinki Läntinen, Helsinki
 More info
Industrial property in Helsinki Läntinen, Helsinki
Industrial property for rent in Helsinki Läntinen, Helsinki
Areal
Ca. 1,065 m2
Pris pr. md.
Not stated
Område
Helsinki Läntinen, Helsinki
Type
Industrial property
Industrial property in Espoo, Uusimaa
 More info
Industrial property in Espoo, Uusimaa
Industrial property for sale in Espoo, Uusimaa
Areal
-
Pris
Not stated
Område
Espoo, Uusimaa
Type
Industrial property
Industrial property in Vantaa, Uusimaa
 More info
Industrial property in Vantaa, Uusimaa
Industrial property for rent in Vantaa, Uusimaa
Areal
Ca. 4,705 m2
Pris pr. md.
Not stated
Område
Vantaa, Uusimaa
Type
Industrial property
Selected customers
30,000 customers use Companyspace.com
30,000 customers
285,000 companies in our database
2,400 rentals annually
Companyspace.com is used by thousands of landlords, property companies, commercial real estate agents, investors and business centres seeking greater visibility, more enquiries and lower vacancy rates.


