


Industrial properties in Finland
Companyspace.com today:
New today 528
Updated 24h 553
Notifications about new companyspaces1,477
Copenhagen +3
Stockholm +2
Brussels +5
Dublin (county) +23
Warsaw +7
Latest update 9 min ago
Active ads 361,219
2,998 industrial properties found
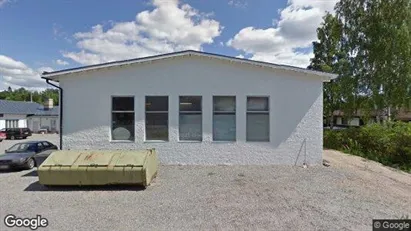
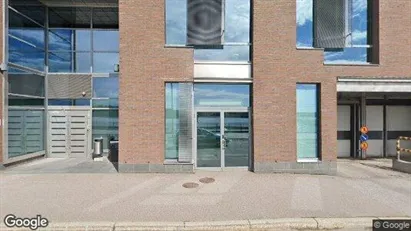
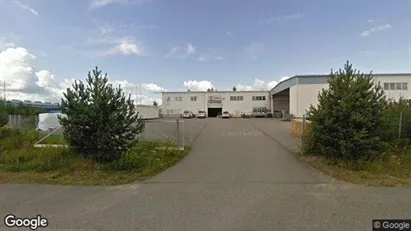
Industrial property in Raisio, Varsinais-Suomi
 More info
Industrial property in Raisio, Varsinais-Suomi
Industrial property for rent in Raisio, Varsinais-Suomi
Areal
Ca. 60 m2
Pris pr. md.
Not stated
Område
Raisio, Varsinais-Suomi
Type
Industrial property
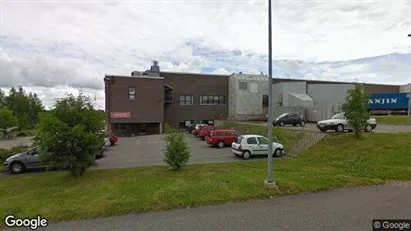
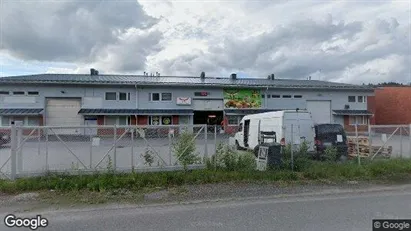
Industrial property in Tampere Keskinen, Tampere
 More info
Industrial property in Tampere Keskinen, Tampere
Industrial property for rent in Tampere Keskinen, Tampere
Areal
310 - 800 m2
Pris pr. md.
Not stated
Område
Tampere Keskinen, Tampere
Type
Industrial property
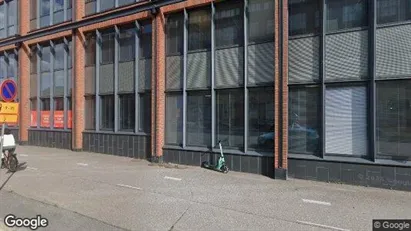
Industrial property in Espoo, Uusimaa
 More info
Industrial property in Espoo, Uusimaa
Industrial property for rent in Espoo, Uusimaa
Areal
100 - 293 m2
Pris pr. md.
Not stated
Område
Espoo, Uusimaa
Type
Industrial property
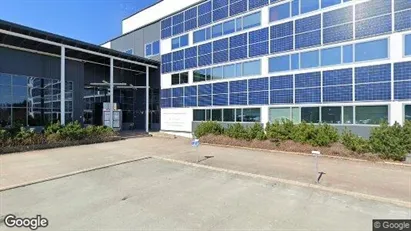
Industrial property in Vantaa, Uusimaa
 More info
Industrial property in Vantaa, Uusimaa
Industrial property for rent in Vantaa, Uusimaa
Areal
Ca. 3,445 m2
Pris pr. md.
Not stated
Område
Vantaa, Uusimaa
Type
Industrial property
Industrial property in Helsinki Läntinen, Helsinki
 More info
Industrial property in Helsinki Läntinen, Helsinki
Industrial property for rent in Helsinki Läntinen, Helsinki
Areal
Ca. 1,175 m2
Pris pr. md.
Not stated
Område
Helsinki Läntinen, Helsinki
Type
Industrial property
Industrial property in Hattula, Kanta-Häme
 More info
Industrial property in Hattula, Kanta-Häme
Industrial property for rent in Hattula, Kanta-Häme
Areal
500 - 5,000 m2
Pris pr. md.
Not stated
Område
Hattula, Kanta-Häme
Type
Industrial property
Industrial property in Helsinki Eteläinen, Helsinki
 More info
Industrial property in Helsinki Eteläinen, Helsinki
Industrial property for rent in Helsinki Eteläinen, Helsinki
Areal
Ca. 500 m2
Pris pr. md.
Not stated
Område
Helsinki Eteläinen, Helsinki
Type
Industrial property
Industrial property in Vantaa, Uusimaa
 More info
Industrial property in Vantaa, Uusimaa
Industrial property for rent in Vantaa, Uusimaa
Areal
Ca. 1,750 m2
Pris pr. md.
Not stated
Område
Vantaa, Uusimaa
Type
Industrial property
Industrial property in Kerava, Uusimaa
 More info
Industrial property in Kerava, Uusimaa
Industrial property for rent in Kerava, Uusimaa
Areal
Ca. 1,100 m2
Pris pr. md.
Not stated
Område
Kerava, Uusimaa
Type
Industrial property
Industrial property in Helsinki Keskinen, Helsinki
 More info
Industrial property in Helsinki Keskinen, Helsinki
Industrial property for rent in Helsinki Keskinen, Helsinki
Areal
Ca. 895 m2
Pris pr. md.
Not stated
Område
Helsinki Keskinen, Helsinki
Type
Industrial property
Industrial property in Helsinki Keskinen, Helsinki
 More info
Industrial property in Helsinki Keskinen, Helsinki
Industrial property for rent in Helsinki Keskinen, Helsinki
Areal
Ca. 450 m2
Pris pr. md.
Not stated
Område
Helsinki Keskinen, Helsinki
Type
Industrial property
Industrial property in Forssa, Kanta-Häme
 More info
Industrial property in Forssa, Kanta-Häme
Industrial property for rent in Forssa, Kanta-Häme
Areal
35 - 1,070 m2
Pris pr. md.
Not stated
Område
Forssa, Kanta-Häme
Type
Industrial property
Industrial property in Turku, Varsinais-Suomi
 More info
Industrial property in Turku, Varsinais-Suomi
Industrial property for rent in Turku, Varsinais-Suomi
Areal
Ca. 420 m2
Pris pr. md.
Not stated
Område
Turku, Varsinais-Suomi
Type
Industrial property
Industrial property in Siilinjärvi, Pohjois-Savo
 More info
Industrial property in Siilinjärvi, Pohjois-Savo
Industrial property for rent in Siilinjärvi, Pohjois-Savo
Areal
Ca. 105 m2
Pris pr. md.
Not stated
Område
Siilinjärvi, Pohjois-Savo
Type
Industrial property
Industrial property in Helsinki Itäinen, Helsinki
 More info
Industrial property in Helsinki Itäinen, Helsinki
Industrial property for rent in Helsinki Itäinen, Helsinki
Areal
Ca. 455 m2
Pris pr. md.
Not stated
Område
Helsinki Itäinen, Helsinki
Type
Industrial property
Industrial property in Helsinki Keskinen, Helsinki
 More info
Industrial property in Helsinki Keskinen, Helsinki
Industrial property for rent in Helsinki Keskinen, Helsinki
Areal
Ca. 350 m2
Pris pr. md.
Not stated
Område
Helsinki Keskinen, Helsinki
Type
Industrial property
Industrial property in Tuusula, Uusimaa
 More info
Industrial property in Tuusula, Uusimaa
Industrial property for rent in Tuusula, Uusimaa
Areal
Ca. 5,885 m2
Pris pr. md.
Not stated
Område
Tuusula, Uusimaa
Type
Industrial property
Industrial property in Turku, Varsinais-Suomi
 More info
Industrial property in Turku, Varsinais-Suomi
Industrial property for rent in Turku, Varsinais-Suomi
Areal
Ca. 195 m2
Pris pr. md.
Not stated
Område
Turku, Varsinais-Suomi
Type
Industrial property
Selected customers
30,000 customers use Companyspace.com
30,000 customers
285,000 companies in our database
2,400 rentals annually
Companyspace.com is used by thousands of landlords, property companies, commercial real estate agents, investors and business centres seeking greater visibility, more enquiries and lower vacancy rates.


