


Industrial properties in Finland
Companyspace.com today:
New today 1,995
Updated 24h 2,499
Notifications about new companyspaces1,874
Copenhagen +2
Stockholm +4
Amsterdam +33
Berlin +1
Oslo +1
Brussels +6
Vienna +33
Paris +12
Madrid +2
Dublin (county) +145
Warsaw +19
Lisbon +1
Greater London +22
Latest update 1 min ago
Active ads 370,467
2,858 industrial properties found
Industrial property in Raisio, Varsinais-Suomi
More info
We monitor the market!
Industrial property in Raisio, Varsinais-Suomi
Industrial property for rent in Raisio, Varsinais-Suomi
Areal
Ca. 500 m2
Pris pr. md.
Ca. 2,150 EUR pr md
Område
Raisio, Varsinais-Suomi
Type
Industrial property
Industrial property in Raisio, Varsinais-Suomi
More info
We monitor the market!
Industrial property in Raisio, Varsinais-Suomi
Industrial property for rent in Raisio, Varsinais-Suomi
Areal
Ca. 240 m2
Pris pr. md.
Ca. 2,050 EUR pr md
Område
Raisio, Varsinais-Suomi
Type
Industrial property
Industrial property in Turku, Varsinais-Suomi
More info
We monitor the market!
Industrial property in Turku, Varsinais-Suomi
Industrial property for rent in Turku, Varsinais-Suomi
Areal
Ca. 1,465 m2
Pris pr. md.
Ca. 9,800 EUR pr md
Område
Turku, Varsinais-Suomi
Type
Industrial property
Industrial property in Raisio, Varsinais-Suomi
More info
We monitor the market!
Industrial property in Raisio, Varsinais-Suomi
Industrial property for rent in Raisio, Varsinais-Suomi
Areal
Ca. 65 m2
Pris pr. md.
Ca. 750 EUR pr md
Område
Raisio, Varsinais-Suomi
Type
Industrial property
Industrial property in Turku, Varsinais-Suomi
More info
We monitor the market!
Industrial property in Turku, Varsinais-Suomi
Industrial property for rent in Turku, Varsinais-Suomi
Areal
Ca. 1,530 m2
Pris pr. md.
Ca. 7,700 EUR pr md
Område
Turku, Varsinais-Suomi
Type
Industrial property
Industrial property in Kaarina, Varsinais-Suomi
More info
We monitor the market!
Industrial property in Kaarina, Varsinais-Suomi
Industrial property for rent in Kaarina, Varsinais-Suomi
Areal
Ca. 590 m2
Pris pr. md.
Ca. 3,700 EUR pr md
Område
Kaarina, Varsinais-Suomi
Type
Industrial property
Industrial property in Turku, Varsinais-Suomi
More info
We monitor the market!
Industrial property in Turku, Varsinais-Suomi
Industrial property for rent in Turku, Varsinais-Suomi
Areal
Ca. 285 m2
Pris pr. md.
Ca. 2,200 EUR pr md
Område
Turku, Varsinais-Suomi
Type
Industrial property
Industrial property in Turku, Varsinais-Suomi
More info
We monitor the market!
Industrial property in Turku, Varsinais-Suomi
Industrial property for rent in Turku, Varsinais-Suomi
Areal
Ca. 650 m2
Pris pr. md.
Ca. 4,250 EUR pr md
Område
Turku, Varsinais-Suomi
Type
Industrial property
Industrial property in Turku, Varsinais-Suomi
More info
We monitor the market!
Industrial property in Turku, Varsinais-Suomi
Industrial property for rent in Turku, Varsinais-Suomi
Areal
Ca. 325 m2
Pris pr. md.
Ca. 2,100 EUR pr md
Område
Turku, Varsinais-Suomi
Type
Industrial property
Industrial property in Turku, Varsinais-Suomi
More info
We monitor the market!
Industrial property in Turku, Varsinais-Suomi
Industrial property for rent in Turku, Varsinais-Suomi
Areal
Ca. 450 m2
Pris pr. md.
Ca. 2,700 EUR pr md
Område
Turku, Varsinais-Suomi
Type
Industrial property
Industrial property in Turku, Varsinais-Suomi
More info
We monitor the market!
Industrial property in Turku, Varsinais-Suomi
Industrial property for rent in Turku, Varsinais-Suomi
Areal
Ca. 1,200 m2
Pris pr. md.
Ca. 7,800 EUR pr md
Område
Turku, Varsinais-Suomi
Type
Industrial property
Industrial property in Turku, Varsinais-Suomi
More info
We monitor the market!
Industrial property in Turku, Varsinais-Suomi
Industrial property for rent in Turku, Varsinais-Suomi
Areal
Ca. 310 m2
Pris pr. md.
Ca. 1,800 EUR pr md
Område
Turku, Varsinais-Suomi
Type
Industrial property
Industrial property in Kaarina, Varsinais-Suomi
More info
We monitor the market!
Industrial property in Kaarina, Varsinais-Suomi
Industrial property for rent in Kaarina, Varsinais-Suomi
Areal
Ca. 50 m2
Pris pr. md.
Ca. 600 EUR pr md
Område
Kaarina, Varsinais-Suomi
Type
Industrial property
Industrial property in Riihimäki, Kanta-Häme
 More info
Industrial property in Riihimäki, Kanta-Häme
Industrial property for rent in Riihimäki, Kanta-Häme
Areal
Ca. 2,900 m2
Pris pr. md.
Not stated
Område
Riihimäki, Kanta-Häme
Type
Industrial property
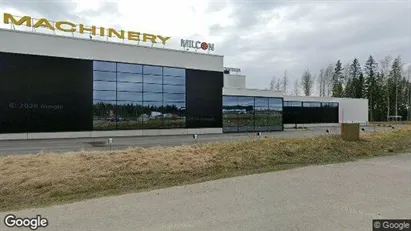
Industrial property in Pirkkala, Pirkanmaa
 More info
Industrial property in Pirkkala, Pirkanmaa
Industrial property for rent in Pirkkala, Pirkanmaa
Areal
Ca. 765 m2
Pris pr. md.
Not stated
Område
Pirkkala, Pirkanmaa
Type
Industrial property
Industrial property in Turku, Varsinais-Suomi
 More info
Industrial property in Turku, Varsinais-Suomi
Industrial property for rent in Turku, Varsinais-Suomi
Areal
-
Pris pr. md.
Not stated
Område
Turku, Varsinais-Suomi
Type
Industrial property
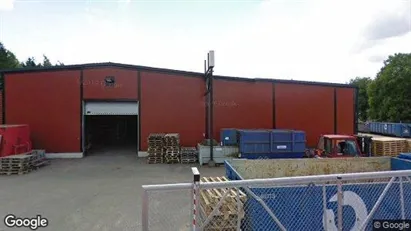
Industrial property in Kempele, Pohjois-Pohjanmaa
 More info
Industrial property in Kempele, Pohjois-Pohjanmaa
Industrial property for rent in Kempele, Pohjois-Pohjanmaa
Areal
Ca. 445 m2
Pris pr. md.
Not stated
Område
Kempele, Pohjois-Pohjanmaa
Type
Industrial property
Industrial property in Jyväskylä, Keski-Suomi
 More info
Industrial property in Jyväskylä, Keski-Suomi
Industrial property for rent in Jyväskylä, Keski-Suomi
Areal
Ca. 1,760 m2
Pris pr. md.
Not stated
Område
Jyväskylä, Keski-Suomi
Type
Industrial property
Selected customers
30,000 customers use Companyspace.com
30,000 customers
285,000 companies in our database
2,400 rentals annually
Companyspace.com is used by thousands of landlords, property companies, commercial real estate agents, investors and business centres seeking greater visibility, more enquiries and lower vacancy rates.


