


Industrial properties in Finland
Companyspace.com today:
Updated 24h 177
Latest update 2 h ago
Active ads 371,560
3,008 industrial properties found
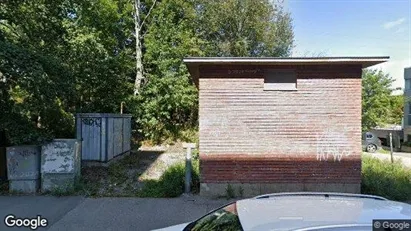
Industrial property in Helsinki Kaakkoinen, Helsinki
 More info
Industrial property in Helsinki Kaakkoinen, Helsinki
Industrial property for rent in Helsinki Kaakkoinen, Helsinki
Areal
Ca. 285 m2
Pris pr. md.
Not stated
Område
Helsinki Kaakkoinen, Helsinki
Type
Industrial property
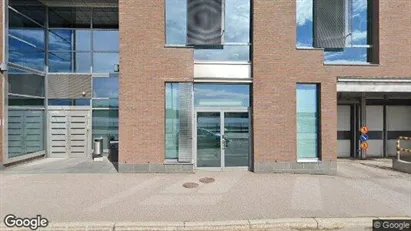
Industrial property in Vantaa, Uusimaa
 More info
Industrial property in Vantaa, Uusimaa
Industrial property for rent in Vantaa, Uusimaa
Areal
Ca. 2,920 m2
Pris pr. md.
Not stated
Område
Vantaa, Uusimaa
Type
Industrial property
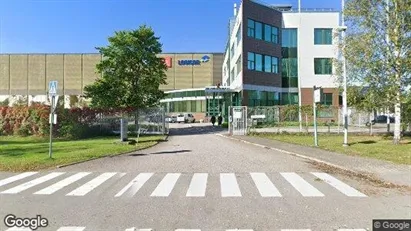
Industrial property in Helsinki Eteläinen, Helsinki
 More info
Industrial property in Helsinki Eteläinen, Helsinki
Industrial property for rent in Helsinki Eteläinen, Helsinki
Areal
Ca. 1,385 m2
Pris pr. md.
Not stated
Område
Helsinki Eteläinen, Helsinki
Type
Industrial property
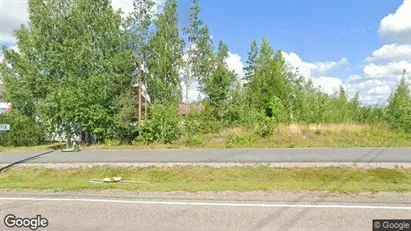
Industrial property in Helsinki Eteläinen, Helsinki
 More info
Industrial property in Helsinki Eteläinen, Helsinki
Industrial property for rent in Helsinki Eteläinen, Helsinki
Areal
Ca. 2,125 m2
Pris pr. md.
Not stated
Område
Helsinki Eteläinen, Helsinki
Type
Industrial property
Industrial property in Vantaa, Uusimaa
 More info
Industrial property in Vantaa, Uusimaa
Industrial property for rent in Vantaa, Uusimaa
Areal
Ca. 1,145 m2
Pris pr. md.
Not stated
Område
Vantaa, Uusimaa
Type
Industrial property
Industrial property in Vantaa, Uusimaa
 More info
Industrial property in Vantaa, Uusimaa
Industrial property for rent in Vantaa, Uusimaa
Areal
Ca. 685 m2
Pris pr. md.
Not stated
Område
Vantaa, Uusimaa
Type
Industrial property
Industrial property in Vantaa, Uusimaa
 More info
Industrial property in Vantaa, Uusimaa
Industrial property for rent in Vantaa, Uusimaa
Areal
Ca. 3,445 m2
Pris pr. md.
Not stated
Område
Vantaa, Uusimaa
Type
Industrial property
Industrial property in Lieto, Varsinais-Suomi
 More info
Industrial property in Lieto, Varsinais-Suomi
Industrial property for rent in Lieto, Varsinais-Suomi
Areal
Ca. 4,700 m2
Pris pr. md.
Not stated
Område
Lieto, Varsinais-Suomi
Type
Industrial property
Industrial property in Tampere Keskinen, Tampere
 More info
Industrial property in Tampere Keskinen, Tampere
Industrial property for rent in Tampere Keskinen, Tampere
Areal
Ca. 2,025 m2
Pris pr. md.
Not stated
Område
Tampere Keskinen, Tampere
Type
Industrial property
Industrial property in Helsinki Eteläinen, Helsinki
 More info
Industrial property in Helsinki Eteläinen, Helsinki
Industrial property for rent in Helsinki Eteläinen, Helsinki
Areal
Ca. 610 m2
Pris pr. md.
Not stated
Område
Helsinki Eteläinen, Helsinki
Type
Industrial property
Industrial property in Kuopio, Pohjois-Savo
 More info
Industrial property in Kuopio, Pohjois-Savo
Industrial property for rent in Kuopio, Pohjois-Savo
Areal
Ca. 365 m2
Pris pr. md.
Not stated
Område
Kuopio, Pohjois-Savo
Type
Industrial property
Industrial property in Jyväskylä, Keski-Suomi
 More info
Industrial property in Jyväskylä, Keski-Suomi
Industrial property for rent in Jyväskylä, Keski-Suomi
Areal
Ca. 605 m2
Pris pr. md.
Not stated
Område
Jyväskylä, Keski-Suomi
Type
Industrial property
Industrial property in Oulu, Pohjois-Pohjanmaa
 More info
Industrial property in Oulu, Pohjois-Pohjanmaa
Industrial property for rent in Oulu, Pohjois-Pohjanmaa
Areal
1,000 - 3,557 m2
Pris pr. md.
Not stated
Område
Oulu, Pohjois-Pohjanmaa
Type
Industrial property
Industrial property in Helsinki Keskinen, Helsinki
 More info
Industrial property in Helsinki Keskinen, Helsinki
Industrial property for rent in Helsinki Keskinen, Helsinki
Areal
Ca. 2,195 m2
Pris pr. md.
Not stated
Område
Helsinki Keskinen, Helsinki
Type
Industrial property
Industrial property in Vantaa, Uusimaa
 More info
Industrial property in Vantaa, Uusimaa
Industrial property for rent in Vantaa, Uusimaa
Areal
Ca. 3,300 m2
Pris pr. md.
Not stated
Område
Vantaa, Uusimaa
Type
Industrial property
Industrial property in Helsinki Keskinen, Helsinki
 More info
Industrial property in Helsinki Keskinen, Helsinki
Industrial property for rent in Helsinki Keskinen, Helsinki
Areal
Ca. 1,255 m2
Pris pr. md.
Not stated
Område
Helsinki Keskinen, Helsinki
Type
Industrial property
Industrial property in Vantaa, Uusimaa
 More info
Industrial property in Vantaa, Uusimaa
Industrial property for rent in Vantaa, Uusimaa
Areal
Ca. 585 m2
Pris pr. md.
Not stated
Område
Vantaa, Uusimaa
Type
Industrial property
Industrial property in Helsinki Keskinen, Helsinki
 More info
Industrial property in Helsinki Keskinen, Helsinki
Industrial property for rent in Helsinki Keskinen, Helsinki
Areal
Ca. 1,370 m2
Pris pr. md.
Not stated
Område
Helsinki Keskinen, Helsinki
Type
Industrial property
Selected customers
30,000 customers use Companyspace.com
30,000 customers
285,000 companies in our database
2,400 rentals annually
Companyspace.com is used by thousands of landlords, property companies, commercial real estate agents, investors and business centres seeking greater visibility, more enquiries and lower vacancy rates.


