


Industrial properties in Finland
Companyspace.com today:
New today 913
Updated 24h 1,188
Notifications about new companyspaces2,307
Copenhagen +3
Amsterdam +17
Berlin +14
Brussels +2
Vienna +14
Dublin (county) +44
Warsaw +47
Latest update 2 min ago
Active ads 360,570
2,973 industrial properties found
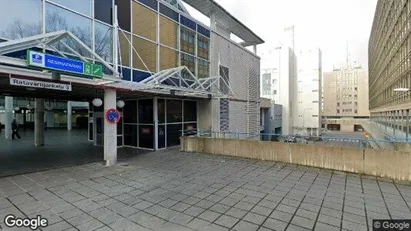
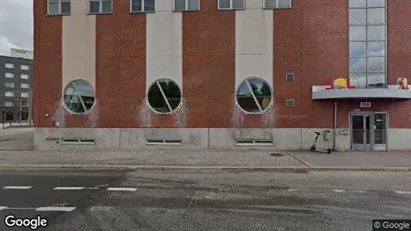
Industrial property in Helsinki Keskinen, Helsinki
 More info
Industrial property in Helsinki Keskinen, Helsinki
Industrial property for rent in Helsinki Keskinen, Helsinki
Areal
Ca. 1,080 m2
Pris pr. md.
Not stated
Område
Helsinki Keskinen, Helsinki
Type
Industrial property
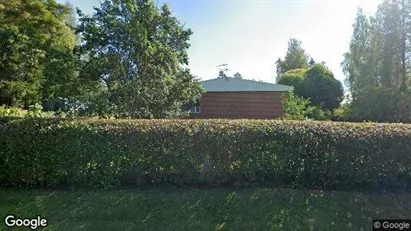
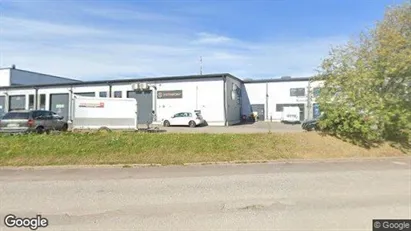
Industrial property in Jämsä, Keski-Suomi
 More info
Industrial property in Jämsä, Keski-Suomi
Industrial property for rent in Jämsä, Keski-Suomi
Areal
-
Pris pr. md.
Not stated
Område
Jämsä, Keski-Suomi
Type
Industrial property
Industrial property in Helsinki Keskinen, Helsinki
 More info
Industrial property in Helsinki Keskinen, Helsinki
Industrial property for rent in Helsinki Keskinen, Helsinki
Areal
Ca. 380 m2
Pris pr. md.
Not stated
Område
Helsinki Keskinen, Helsinki
Type
Industrial property
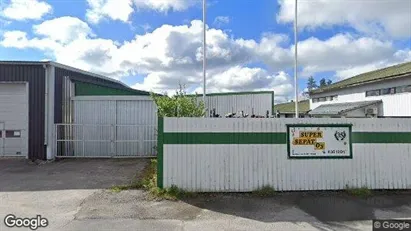
Industrial property in Pirkkala, Pirkanmaa
 More info
Industrial property in Pirkkala, Pirkanmaa
Industrial property for rent in Pirkkala, Pirkanmaa
Areal
Ca. 1,000 m2
Pris pr. md.
Not stated
Område
Pirkkala, Pirkanmaa
Type
Industrial property
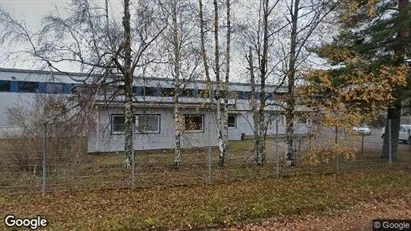
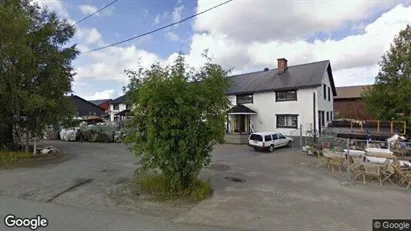
Industrial property in Hattula, Kanta-Häme
 More info
Industrial property in Hattula, Kanta-Häme
Industrial property for rent in Hattula, Kanta-Häme
Areal
500 - 5,000 m2
Pris pr. md.
Not stated
Område
Hattula, Kanta-Häme
Type
Industrial property
Industrial property in Helsinki Keskinen, Helsinki
 More info
Industrial property in Helsinki Keskinen, Helsinki
Industrial property for rent in Helsinki Keskinen, Helsinki
Areal
Ca. 1,255 m2
Pris pr. md.
Not stated
Område
Helsinki Keskinen, Helsinki
Type
Industrial property
Industrial property in Lieto, Varsinais-Suomi
 More info
Industrial property in Lieto, Varsinais-Suomi
Industrial property for rent in Lieto, Varsinais-Suomi
Areal
Ca. 3,200 m2
Pris pr. md.
Not stated
Område
Lieto, Varsinais-Suomi
Type
Industrial property
Industrial property in Kirkkonummi, Uusimaa
 More info
Industrial property in Kirkkonummi, Uusimaa
Industrial property for rent in Kirkkonummi, Uusimaa
Areal
Ca. 1,200 m2
Pris pr. md.
Not stated
Område
Kirkkonummi, Uusimaa
Type
Industrial property
Industrial property in Lahti, Päijät-Häme
 More info
Industrial property in Lahti, Päijät-Häme
Industrial property for rent in Lahti, Päijät-Häme
Areal
Ca. 600 m2
Pris pr. md.
Not stated
Område
Lahti, Päijät-Häme
Type
Industrial property
Industrial property in Helsinki Keskinen, Helsinki
 More info
Industrial property in Helsinki Keskinen, Helsinki
Industrial property for rent in Helsinki Keskinen, Helsinki
Areal
-
Pris pr. md.
Not stated
Område
Helsinki Keskinen, Helsinki
Type
Industrial property
Industrial property in Espoo, Uusimaa
 More info
Industrial property in Espoo, Uusimaa
Industrial property for rent in Espoo, Uusimaa
Areal
Ca. 195 m2
Pris pr. md.
Not stated
Område
Espoo, Uusimaa
Type
Industrial property
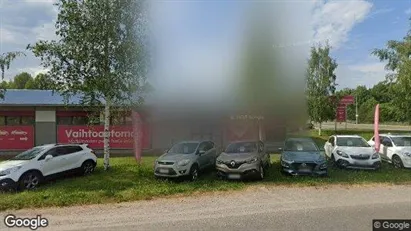
Industrial property in Vaasa, Pohjanmaa
 More info
Industrial property in Vaasa, Pohjanmaa
Industrial property for rent in Vaasa, Pohjanmaa
Areal
50 - 368 m2
Pris pr. md.
Not stated
Område
Vaasa, Pohjanmaa
Type
Industrial property
Industrial property in Raisio, Varsinais-Suomi
 More info
Industrial property in Raisio, Varsinais-Suomi
Industrial property for rent in Raisio, Varsinais-Suomi
Areal
97 - 280 m2
Pris pr. md.
Not stated
Område
Raisio, Varsinais-Suomi
Type
Industrial property
Industrial property in Helsinki Keskinen, Helsinki
 More info
Industrial property in Helsinki Keskinen, Helsinki
Industrial property for rent in Helsinki Keskinen, Helsinki
Areal
Ca. 350 m2
Pris pr. md.
Not stated
Område
Helsinki Keskinen, Helsinki
Type
Industrial property
Industrial property in Helsinki Eteläinen, Helsinki
 More info
Industrial property in Helsinki Eteläinen, Helsinki
Industrial property for rent in Helsinki Eteläinen, Helsinki
Areal
Ca. 695 m2
Pris pr. md.
Not stated
Område
Helsinki Eteläinen, Helsinki
Type
Industrial property
Industrial property in Kankaanpää, Satakunta
 More info
Industrial property in Kankaanpää, Satakunta
Industrial property for rent in Kankaanpää, Satakunta
Areal
Ca. 320 m2
Pris pr. md.
Not stated
Område
Kankaanpää, Satakunta
Type
Industrial property
Industrial property in Helsinki Keskinen, Helsinki
 More info
Industrial property in Helsinki Keskinen, Helsinki
Industrial property for rent in Helsinki Keskinen, Helsinki
Areal
Ca. 1,370 m2
Pris pr. md.
Not stated
Område
Helsinki Keskinen, Helsinki
Type
Industrial property
Industrial property in Riihimäki, Kanta-Häme
 More info
Industrial property in Riihimäki, Kanta-Häme
Industrial property for rent in Riihimäki, Kanta-Häme
Areal
Ca. 2,000 m2
Pris pr. md.
Not stated
Område
Riihimäki, Kanta-Häme
Type
Industrial property
Selected customers
30,000 customers use Companyspace.com
30,000 customers
285,000 companies in our database
2,400 rentals annually
Companyspace.com is used by thousands of landlords, property companies, commercial real estate agents, investors and business centres seeking greater visibility, more enquiries and lower vacancy rates.


