


Commercial premises for rent in Europe
There are 271,554 available commercial properties in Europe right now. Companyspace.com collects commercial properties from many different parts of the market, so that you as a company can more easily get an overview of available commercial properties in Europe.
Companyspace.com today:
New today 105
Updated 24h 1,145
Copenhagen +2
Amsterdam +1
Brussels +1
Vienna +14
Latest update 1 min ago
Active ads 358,387
271,554 company spaces found
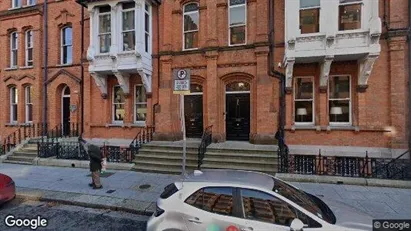
Office space in Dublin 15, Dublin
 More info
Office space in Dublin 15, Dublin
Office space for rent in Dublin 15, Dublin
Areal
Ca. 15 m2
Pris pr. md.
Ca. 900 EUR pr md
Område
Dublin 15, Dublin
Type
Office space
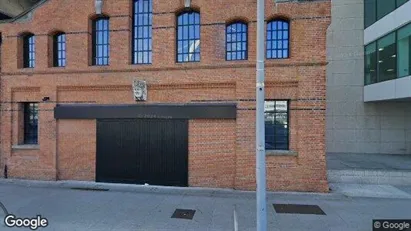
Commercial space in Halderberge, North Brabant
 More info
Commercial space in Halderberge, North Brabant
Commercial space for rent in Halderberge, North Brabant
Areal
Ca. 200 m2
Pris pr. md.
Ca. 1,950 EUR pr md
Område
Halderberge, North Brabant
Type
Commercial property
Office space in Dublin 2, Dublin
 More info
Office space in Dublin 2, Dublin
Office space for rent in Dublin 2, Dublin
Areal
Ca. 15 m2
Pris pr. md.
Ca. 1,400 EUR pr md
Område
Dublin 2, Dublin
Type
Office space
Office space in Brecht, Antwerp (Province)
 More info
Office space in Brecht, Antwerp (Province)
Office space for rent in Brecht, Antwerp (Province)
Areal
Ca. 640 m2
Pris pr. md.
Ca. 6,900 EUR pr md
Område
Brecht, Antwerp (Province)
Type
Office space
Office space in Dublin 2, Dublin
 More info
Office space in Dublin 2, Dublin
Office space for rent in Dublin 2, Dublin
Areal
Ca. 210 m2
Pris pr. md.
Ca. 5,600 EUR pr md
Område
Dublin 2, Dublin
Type
Office space
Commercial space in Alkmaar, North Holland
 More info
Commercial space in Alkmaar, North Holland
Commercial space for rent in Alkmaar, North Holland
Areal
Ca. 90 m2
Pris pr. md.
Ca. 1,500 EUR pr md
Område
Alkmaar, North Holland
Type
Commercial property
Office space in Stad Antwerp, Antwerp
 More info
Office space in Stad Antwerp, Antwerp
Office space for rent in Stad Antwerp, Antwerp
Areal
Ca. 380 m2
Pris pr. md.
Ca. 4,250 EUR pr md
Område
Stad Antwerp, Antwerp
Type
Office space
Office space in Gennep, Limburg
 More info
Office space in Gennep, Limburg
Office space for rent in Gennep, Limburg
Areal
Ca. 335 m2
Pris pr. md.
Ca. 2,500 EUR pr md
Område
Gennep, Limburg
Type
Office space
Office space in Dublin 18, Dublin
 More info
Office space in Dublin 18, Dublin
Office space for rent in Dublin 18, Dublin
Areal
Ca. 5 m2
Pris pr. md.
Ca. 100 EUR pr md
Område
Dublin 18, Dublin
Type
Office space
Office space in Dublin 18, Dublin
 More info
Office space in Dublin 18, Dublin
Office space for rent in Dublin 18, Dublin
Areal
Ca. 25 m2
Pris pr. md.
Ca. 1,500 EUR pr md
Område
Dublin 18, Dublin
Type
Office space
Industrial property in Braintree - Essex, East of England
 More info
Industrial property in Braintree - Essex, East of England
Production for rent in Braintree - Essex, East of England
Areal
-
Pris pr. md.
Ca. 2,100 GBP pr md
Område
Braintree - Essex, East of England
Type
Industrial property
Office space in Dublin 15, Dublin
 More info
Office space in Dublin 15, Dublin
Office space for rent in Dublin 15, Dublin
Areal
Ca. 5 m2
Pris pr. md.
Ca. 100 EUR pr md
Område
Dublin 15, Dublin
Type
Office space
Office space in Skanderborg, Central Jutland Region
 More info
Office space in Skanderborg, Central Jutland Region
Office space for rent in Skanderborg, Central Jutland Region
Areal
Ca. 150 m2
Pris pr. md.
Ca. 14,900 DKK pr md
Område
Skanderborg, Central Jutland Region
Type
Office space
Office space in Dublin 2, Dublin
 More info
Office space in Dublin 2, Dublin
Office space for rent in Dublin 2, Dublin
Areal
Ca. 25 m2
Pris pr. md.
Ca. 3,150 EUR pr md
Område
Dublin 2, Dublin
Type
Office space
Office space in Dublin 2, Dublin
 More info
Office space in Dublin 2, Dublin
Office space for rent in Dublin 2, Dublin
Areal
Ca. 10 m2
Pris pr. md.
Ca. 437,650 EUR pr md
Område
Dublin 2, Dublin
Type
Office space
Office space in Dublin 15, Dublin
 More info
Office space in Dublin 15, Dublin
Office space for rent in Dublin 15, Dublin
Areal
Ca. 15 m2
Pris pr. md.
Ca. 1,100 EUR pr md
Område
Dublin 15, Dublin
Type
Office space
Office space in Dublin 15, Dublin
 More info
Office space in Dublin 15, Dublin
Office space for rent in Dublin 15, Dublin
Areal
Ca. 30 m2
Pris pr. md.
Ca. 2,050 EUR pr md
Område
Dublin 15, Dublin
Type
Office space
Office space in Gooise Meren, North Holland
 More info
Office space in Gooise Meren, North Holland
Office space for rent in Gooise Meren, North Holland
Areal
Ca. 25 m2
Pris pr. md.
Ca. 50 EUR pr md
Område
Gooise Meren, North Holland
Type
Office space
Selected customers
30,000 customers use Companyspace.com
30,000 customers
285,000 companies in our database
2,400 rentals annually
Companyspace.com is used by thousands of landlords, property companies, commercial real estate agents, investors and business centres seeking greater visibility, more enquiries and lower vacancy rates.


