


Commercial premises for rent in Europe
There are 281,974 available commercial properties in Europe right now. Companyspace.com collects commercial properties from many different parts of the market, so that you as a company can more easily get an overview of available commercial properties in Europe.
Companyspace.com today:
New today 520
Updated 24h 1,529
Notifications about new companyspaces1,785
Copenhagen +2
Amsterdam +12
Berlin +1
Vienna +15
Paris +5
Dublin (county) +48
Warsaw +12
Greater London +6
Latest update 18 min ago
Active ads 369,117
281,974 company spaces found
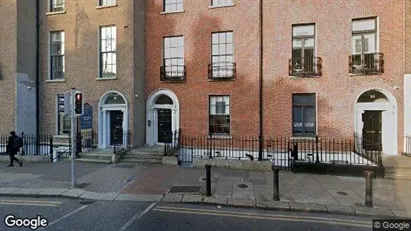
Office space in Dublin 2, Dublin
 More info
Office space in Dublin 2, Dublin
Office space for rent in Dublin 2, Dublin
Areal
Ca. 20 m2
Pris pr. md.
Ca. 1,700 EUR pr md
Område
Dublin 2, Dublin
Type
Office space
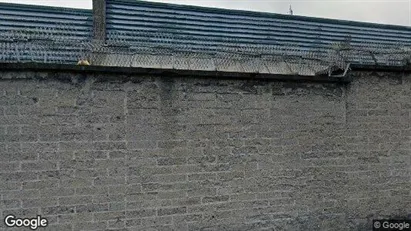
Industrial property in Dublin 3, Dublin
 More info
Industrial property in Dublin 3, Dublin
Industrial property for rent in Dublin 3, Dublin
Areal
Ca. 385 m2
Pris pr. md.
Ca. 5,150 EUR pr md
Område
Dublin 3, Dublin
Type
Industrial property
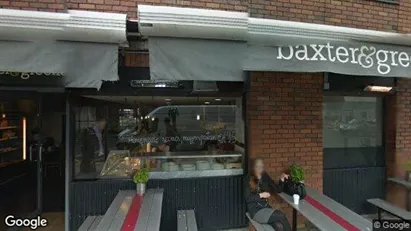
Office space in Dublin 2, Dublin
 More info
Office space in Dublin 2, Dublin
Office space for rent in Dublin 2, Dublin
Areal
Ca. 335 m2
Pris pr. md.
Ca. 13,550 EUR pr md
Område
Dublin 2, Dublin
Type
Office space
Warehouse in Hadsten, Central Jutland Region
 More info
Warehouse in Hadsten, Central Jutland Region
Warehouse for rent in Hadsten, Central Jutland Region
Areal
Ca. 485 m2
Pris pr. md.
Ca. 15,000 DKK pr md
Område
Hadsten, Central Jutland Region
Type
Warehouse
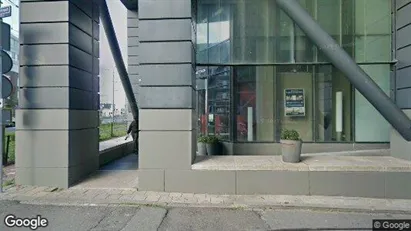
Office space in Dublin 7, Dublin
 More info
Office space in Dublin 7, Dublin
Office space for rent in Dublin 7, Dublin
Areal
Ca. 70 m2
Pris pr. md.
Ca. 8,850 EUR pr md
Område
Dublin 7, Dublin
Type
Office space
Office space in Dublin 2, Dublin
 More info
Office space in Dublin 2, Dublin
Office space for rent in Dublin 2, Dublin
Areal
Ca. 10 m2
Pris pr. md.
Ca. 600 EUR pr md
Område
Dublin 2, Dublin
Type
Office space
Office space in Dublin 2, Dublin
 More info
Office space in Dublin 2, Dublin
Office space for rent in Dublin 2, Dublin
Areal
Ca. 20 m2
Pris pr. md.
Ca. 1,650 EUR pr md
Område
Dublin 2, Dublin
Type
Office space
Office space in The Hague Laak, The Hague
 More info
Office space in The Hague Laak, The Hague
Office space for rent in The Hague Laak, The Hague
Areal
Ca. 855 m2
Pris pr. md.
Ca. 150 EUR pr md
Område
The Hague Laak, The Hague
Type
Office space
Office space in Dublin 7, Dublin
 More info
Office space in Dublin 7, Dublin
Office space for rent in Dublin 7, Dublin
Areal
Ca. 30 m2
Pris pr. md.
Ca. 1,900 EUR pr md
Område
Dublin 7, Dublin
Type
Office space
Office space in Dublin 2, Dublin
 More info
Office space in Dublin 2, Dublin
Office space for rent in Dublin 2, Dublin
Areal
Ca. 95 m2
Pris pr. md.
Ca. 5,000 EUR pr md
Område
Dublin 2, Dublin
Type
Office space
Office space in Aarhus N, Aarhus
 More info
Office space in Aarhus N, Aarhus
Office space for rent in Aarhus N, Aarhus
Areal
Ca. 480 m2
Pris pr. md.
Ca. 43,900 DKK pr md
Område
Aarhus N, Aarhus
Type
Office space
Office space in Dublin 15, Dublin
 More info
Office space in Dublin 15, Dublin
Office space for rent in Dublin 15, Dublin
Areal
Ca. 15 m2
Pris pr. md.
Ca. 900 EUR pr md
Område
Dublin 15, Dublin
Type
Office space
Commercial space in Halderberge, North Brabant
 More info
Commercial space in Halderberge, North Brabant
Commercial space for rent in Halderberge, North Brabant
Areal
Ca. 200 m2
Pris pr. md.
Ca. 1,950 EUR pr md
Område
Halderberge, North Brabant
Type
Commercial property
Office space in Dublin 2, Dublin
 More info
Office space in Dublin 2, Dublin
Office space for rent in Dublin 2, Dublin
Areal
Ca. 15 m2
Pris pr. md.
Ca. 1,400 EUR pr md
Område
Dublin 2, Dublin
Type
Office space
Office space in Brecht, Antwerp (Province)
 More info
Office space in Brecht, Antwerp (Province)
Office space for rent in Brecht, Antwerp (Province)
Areal
Ca. 640 m2
Pris pr. md.
Ca. 6,900 EUR pr md
Område
Brecht, Antwerp (Province)
Type
Office space
Office space in Haarlemmermeer, North Holland
 More info
Office space in Haarlemmermeer, North Holland
Office space for rent in Haarlemmermeer, North Holland
Areal
Ca. 75 m2
Pris pr. md.
Ca. 1,650 EUR pr md
Område
Haarlemmermeer, North Holland
Type
Office space
Office space in Dublin 2, Dublin
 More info
Office space in Dublin 2, Dublin
Office space for rent in Dublin 2, Dublin
Areal
Ca. 210 m2
Pris pr. md.
Ca. 5,600 EUR pr md
Område
Dublin 2, Dublin
Type
Office space
Commercial space in Alkmaar, North Holland
 More info
Commercial space in Alkmaar, North Holland
Commercial space for rent in Alkmaar, North Holland
Areal
Ca. 90 m2
Pris pr. md.
Ca. 1,500 EUR pr md
Område
Alkmaar, North Holland
Type
Commercial property
Selected customers
30,000 customers use Companyspace.com
30,000 customers
285,000 companies in our database
2,400 rentals annually
Companyspace.com is used by thousands of landlords, property companies, commercial real estate agents, investors and business centres seeking greater visibility, more enquiries and lower vacancy rates.


